
多Y轴尺度变化的叠加平面图
多Y轴尺度变化的叠加平面图
提问于 2020-04-14 07:50:39
嗨,我正在努力创造:
- 水平叠加的地块
- 在两块地块上都有二轴,
- 在轴上有不同的尺度--不幸的是,我的Y轴目前每个子图都有相同的比例.:(
)
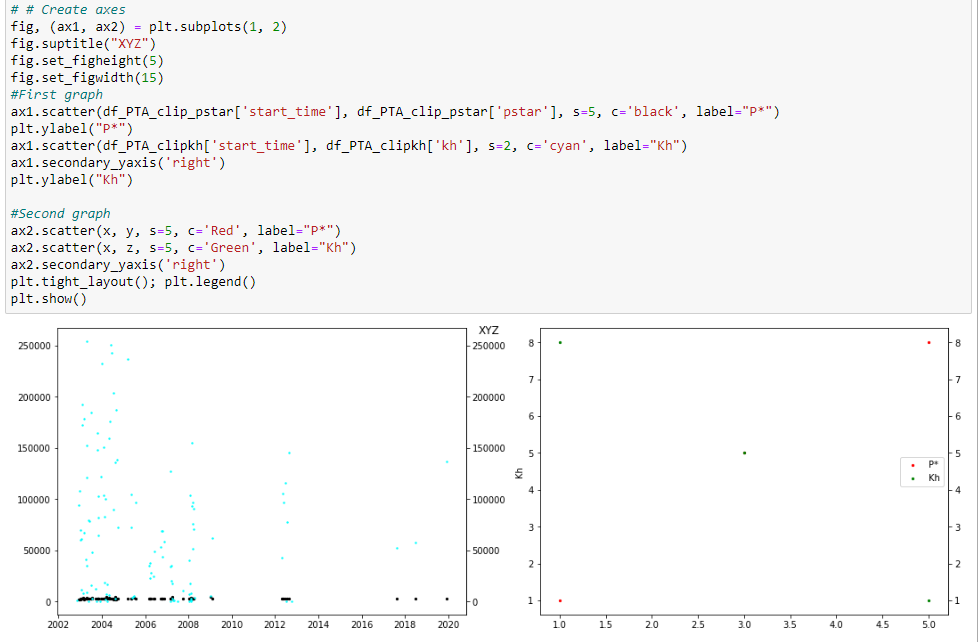
当前代码:
#  Create axes
fig, (ax1, ax2) = plt.subplots(1, 2)
fig.suptitle("XYZ")
fig.set_figheight(5)
fig.set_figwidth(15)
# First graph
ax1.scatter(
    df_PTA_clip_pstar["start_time"],
    df_PTA_clip_pstar["pstar"],
    s=5,
    c="black",
    label="P*",
)
plt.ylabel("P*")
ax1.scatter(df_PTA_clipkh["start_time"], df_PTA_clipkh["kh"], s=2, c="cyan", label="Kh")
ax1.secondary_yaxis("right")
plt.ylabel("Kh")

# Second graph - will add the correct data to this once first graph fixed
ax2.scatter(x, y, s=5, c="Red", label="P*")
ax2.scatter(x, z, s=5, c="Green", label="Kh")

ax2.secondary_yaxis("right")
plt.tight_layout()
plt.legend()
plt.show()
目前的进展:
回答 1
Stack Overflow用户
回答已采纳
发布于 2020-04-15 06:47:50
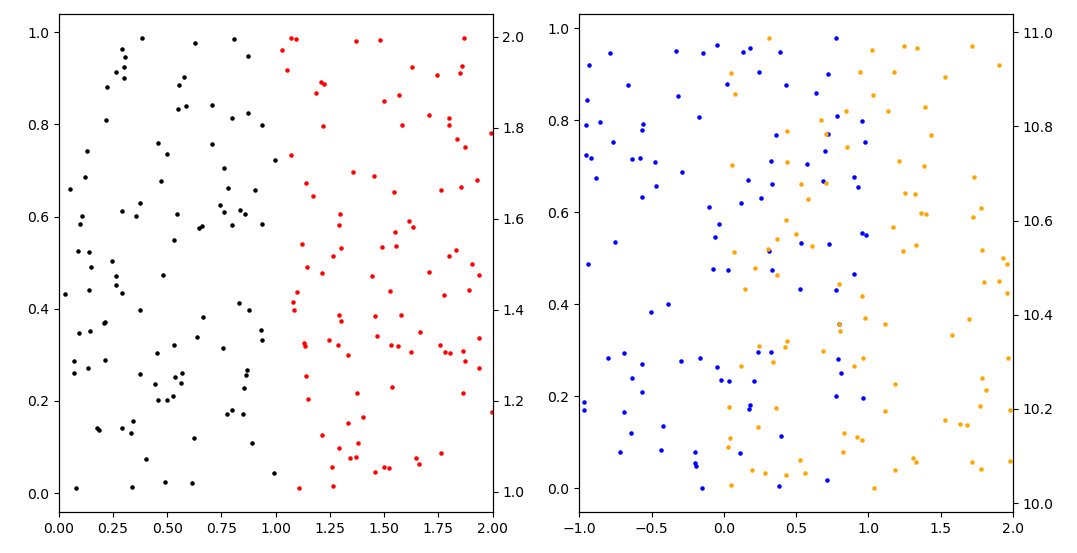
您可以对每个ax对象使用.twinx()方法,这样就可以在相同的ax对象共享x轴上绘制两幅图:
import matplotlib.pyplot as plt
import numpy as np


#  Create axes
fig, (ax1, ax2) = plt.subplots(1, 2)

## First subplot
x = np.random.random_sample(100)
y = np.random.random_sample(100)

ax1.set_xlim(0, 2)
ax1.scatter(x, y,
            s=5,
            c="black")

ax11 = ax1.twinx()
x = 1 + x
y = 1 + np.random.random_sample(100)
ax11.scatter(x, y,
             s=5,
             c="red")

## Second subplot
x = 2 * np.random.random_sample(100) - 1
y = np.random.random_sample(100)

ax2.set_xlim(-1, 2)
ax2.scatter(x, y,
            s=5,
            c="blue")

ax21 = ax2.twinx()
x = 1 + x
y = 10 + np.random.random_sample(100)
ax21.scatter(x, y,
             s=5,
             c="orange")

plt.show()
页面原文内容由Stack Overflow提供。腾讯云小微IT领域专用引擎提供翻译支持
原文链接:
https://stackoverflow.com/questions/61202994
复制相关文章
相似问题
腾讯云开发者

Copyright © 2013 - 2026 Tencent Cloud. All Rights Reserved. 腾讯云 版权所有
深圳市腾讯计算机系统有限公司 ICP备案/许可证号:粤B2-20090059 ![]() 粤公网安备44030502008569号
粤公网安备44030502008569号
腾讯云计算(北京)有限责任公司 京ICP证150476号 | 京ICP备11018762号