
ValueError:年份0已超出海运范围
ValueError:年份0已超出海运范围
提问于 2020-04-01 16:09:11
我很难用海运来绘制一个简单的时间序列,我不明白为什么这个过程不起作用。我的dataframe time_series给出了2015年至2019年期间患者的每日数据,并且datetime index.It看起来也是这样的:
            patients
Date
2015-01-04        49
2015-01-05        51
2015-01-06        48
2015-01-07        30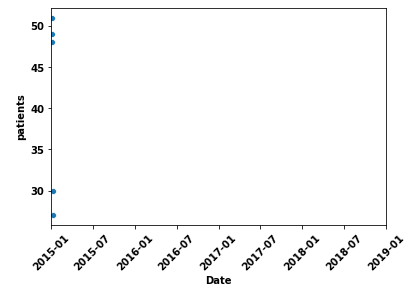
2015-01-08 27我试图构建一个散点图,但是在构建它时,它从2000年开始,因此所有的数据点都在图的右边。我试图通过设置一个xlim来解决这个问题,但是收到了一个奇怪的错误。我的代码是这样的:
import seaborn as sns
import matplotlib.pyplot as plt

sns.scatterplot(x=time_series.index, y=time_series['patients'])
plt.xlim(2015,2019)
这是我不明白的错误,因为我没有‘0’年:
ValueError: year 0 is out of range有人能帮我一下吗。非常感谢
回答 1
Stack Overflow用户
发布于 2020-04-01 18:47:54
问题似乎是,来自locs.
- If的
datetime信息被转换为使用locs, labels = plt.xticks()、注释掉plt.xlim和打印locs的绘图df.index的日期时间序号表示,您将看到它们是array([729390.00000485, 730120.00000485, 730851.00000485, 731581.00000485, 732312.00000485, 733042.00000485, 733773.00000485, 734503.00000485, 735234.00000485, 735964.00000485])。因此,当您设置plt.xlim(2015, 2019)时,您不在正在绘制的locs范围内。这些年只不过是一个日期时间索引labels.
- Given
的示例数据格式
from datetime import date, datetime

# determine ordinal value for desired date range
print(date.toordinal(datetime(2015, 1, 1, 0, 0)))
>>>735599
print(date.toordinal(datetime(2019, 1, 1, 0, 0)))
>>>737060

chart = sns.scatterplot(x=df.index, y=df['patients'])
plt.xlim(735599, 737060)

plt.setp(chart.get_xticklabels(), rotation=45)
plt.show()
页面原文内容由Stack Overflow提供。腾讯云小微IT领域专用引擎提供翻译支持
原文链接:
https://stackoverflow.com/questions/60975357
复制相关文章
相似问题
腾讯云开发者

Copyright © 2013 - 2026 Tencent Cloud. All Rights Reserved. 腾讯云 版权所有
深圳市腾讯计算机系统有限公司 ICP备案/许可证号:粤B2-20090059 ![]() 粤公网安备44030502008569号
粤公网安备44030502008569号
腾讯云计算(北京)有限责任公司 京ICP证150476号 | 京ICP备11018762号