
如何在Python中进行实时语音活动检测?
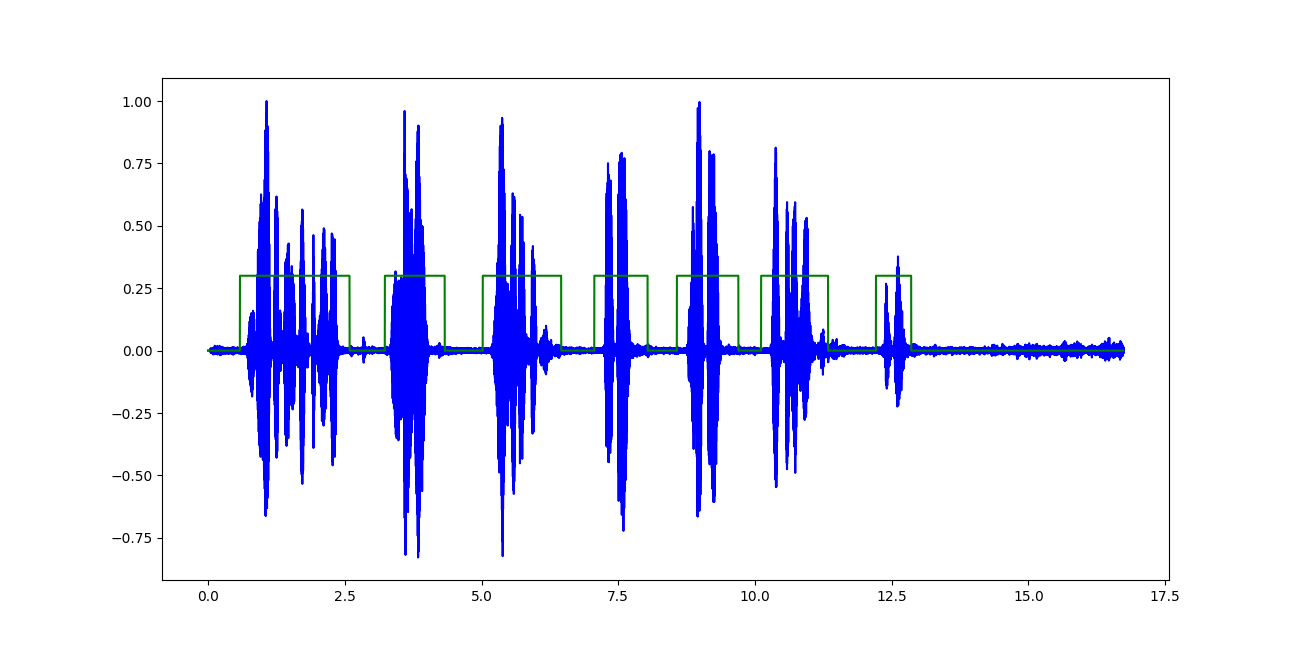
我正在对记录的音频文件执行语音活动检测,以检测波形中的语音和非语音部分。
分类器的输出类似于(突出显示的绿色区域表示语音):
我在这里面临的唯一问题是让它工作的音频输入流(例如:从麦克风),并做一个规定的时间框架的实时分析。
我知道PyAudio可以用来动态地记录麦克风上的语音,还有一些波形、频谱、谱图等实时可视化的例子,但是没有找到任何与以近乎实时的方式进行特征提取相关的东西。
回答 4
Stack Overflow用户
发布于 2020-03-31 08:31:32
您应该尝试使用Python绑定到谷歌的webRTC VAD。它的重量轻,速度快,提供了非常合理的结果,基于GMM建模。由于每个帧都提供了决策,所以延迟是最小的。
# Run the VAD on 10 ms of silence. The result should be False.
import webrtcvad
vad = webrtcvad.Vad(2)

sample_rate = 16000
frame_duration = 10  # ms
frame = b'\x00\x00' * int(sample_rate * frame_duration / 1000)
print('Contains speech: %s' % (vad.is_speech(frame, sample_rate))另外,这文章可能对您有用。
Stack Overflow用户
发布于 2020-04-03 07:26:37
我发现LibROSA可能是解决问题的方法之一。有一个简单的教程关于5~6成熟如何使用麦克风流来实现实时预测.
让我们使用短时傅立叶变换(STFT)作为特征提取器,作者解释道:
计算短时傅里叶变换窗口大小(N_fft)为512。根据方程n_stft = n_fft/2 + 1,在512个窗口上计算了257个频率箱(N_stft)。窗口以256的跳长移动,以便在计算STFT时具有更好的窗口重叠。
stft = np.abs(librosa.stft(trimmed, n_fft=512, hop_length=256, win_length=512))
# Plot audio with zoomed in y axis
def plotAudio(output):
    fig, ax = plt.subplots(nrows=1,ncols=1, figsize=(20,10))
    plt.plot(output, color='blue')
    ax.set_xlim((0, len(output)))
    ax.margins(2, -0.1)
    plt.show()

# Plot audio
def plotAudio2(output):
    fig, ax = plt.subplots(nrows=1,ncols=1, figsize=(20,4))
    plt.plot(output, color='blue')
    ax.set_xlim((0, len(output)))
    plt.show()

def minMaxNormalize(arr):
    mn = np.min(arr)
    mx = np.max(arr)
    return (arr-mn)/(mx-mn)

def predictSound(X):
    clip, index = librosa.effects.trim(X, top_db=20, frame_length=512, hop_length=64) # Empherically select top_db for every sample
    stfts = np.abs(librosa.stft(clip, n_fft=512, hop_length=256, win_length=512))
    stfts = np.mean(stfts,axis=1)
    stfts = minMaxNormalize(stfts)
    result = model.predict(np.array([stfts]))
    predictions = [np.argmax(y) for y in result]
    print(lb.inverse_transform([predictions[0]])[0])
    plotAudio2(clip)

CHUNKSIZE = 22050 # fixed chunk size
RATE = 22050

p = pyaudio.PyAudio()
stream = p.open(format=pyaudio.paFloat32, channels=1,
rate=RATE, input=True, frames_per_buffer=CHUNKSIZE)

#preprocessing the noise around
#noise window
data = stream.read(10000)
noise_sample = np.frombuffer(data, dtype=np.float32)
print("Noise Sample")
plotAudio2(noise_sample)
loud_threshold = np.mean(np.abs(noise_sample)) * 10
print("Loud threshold", loud_threshold)
audio_buffer = []
near = 0

while(True):
    # Read chunk and load it into numpy array.
    data = stream.read(CHUNKSIZE)
    current_window = np.frombuffer(data, dtype=np.float32)

    #Reduce noise real-time
    current_window = nr.reduce_noise(audio_clip=current_window, noise_clip=noise_sample, verbose=False)

    if(audio_buffer==[]):
        audio_buffer = current_window
    else:
        if(np.mean(np.abs(current_window))<loud_threshold):
            print("Inside silence reign")
            if(near<10):
                audio_buffer = np.concatenate((audio_buffer,current_window))
                near += 1
            else:
                predictSound(np.array(audio_buffer))
                audio_buffer = []
                near
        else:
            print("Inside loud reign")
            near = 0
            audio_buffer = np.concatenate((audio_buffer,current_window))

# close stream
stream.stop_stream()
stream.close()
p.terminate()代码:Chathuranga Siriwardhana
完整的代码可以找到这里。
Stack Overflow用户
发布于 2020-03-28 09:55:26
我认为有两种方法,
- 阈值法
- 小的,可展开的,神经网络方法
第一种是快速、可行的,可以实现,测试非常快的。而第二个则更难实现。我想你已经有点熟悉第二种选择了。
在第二种方法中,您需要一个在二进制分类序列(如00000000111111110000000011110000 )中标记的演讲数据集。该神经网络应该是小的,并优化运行在边缘设备,如移动。
您可以从这中查看TensorFlow。
这是一种语音活动检测器。我想这是为了你的目的。
还有,看看这些。
https://github.com/pyannote/pyannote-audio
当然,您应该比较上述工具包和模型的性能implementation 和移动设备的可行性。
https://stackoverflow.com/questions/60832201
复制相似问题
腾讯云开发者

Copyright © 2013 - 2026 Tencent Cloud. All Rights Reserved. 腾讯云 版权所有
深圳市腾讯计算机系统有限公司 ICP备案/许可证号:粤B2-20090059 ![]() 粤公网安备44030502008569号
粤公网安备44030502008569号
腾讯云计算(北京)有限责任公司 京ICP证150476号 | 京ICP备11018762号