
图文前面的箭头
图文前面的箭头
提问于 2020-03-20 20:34:36
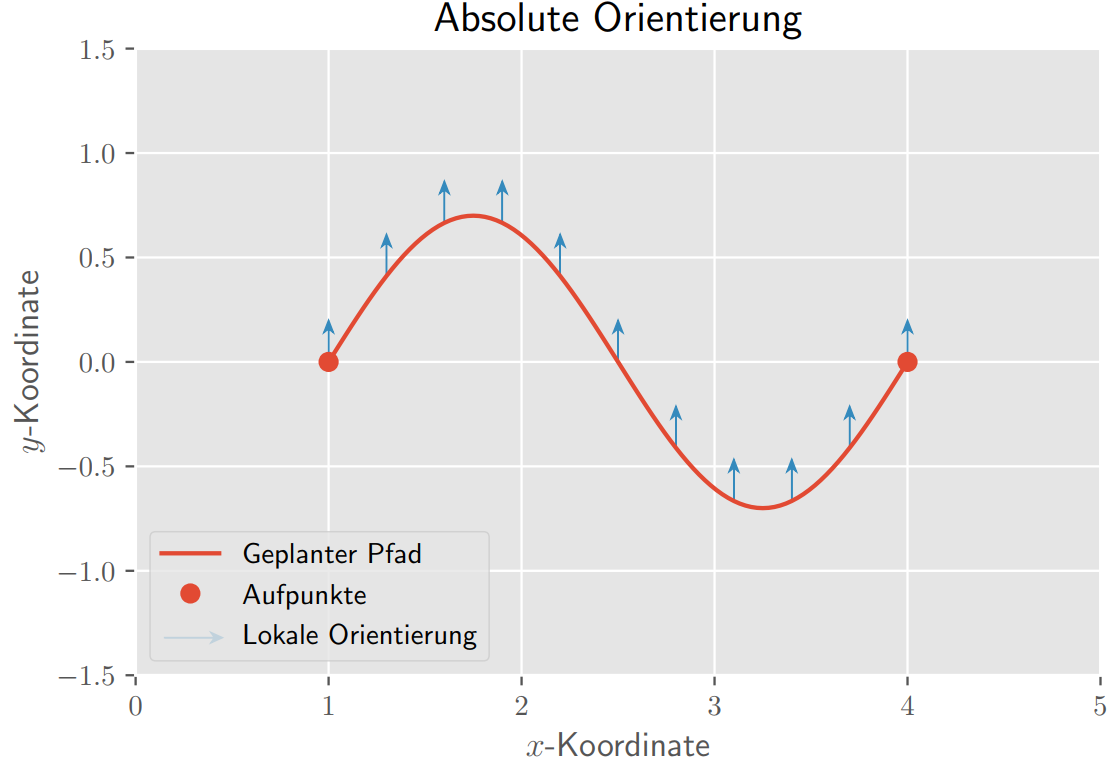
我对Python完全陌生,我正试图为我的单身汉论文设计一个情节。此图包含必须出现在图例中的箭头。我在Stackoverflow上看到了一些问题,如何在传说中添加箭头,但无法遵循它们。所以我用零线宽做了一行占位符,想在图例前面生成一个箭头。不幸的是,我不能把箭放在传说的前面。您可以在最后一行的第二个代码行中看到我的箭头。我试着用"zorder“把它移到前面,但它不起作用。只有通过透明的图例才能看到它,就像你在链接的图形中看到的那样。我很高兴能在传说中得到这支箭。提前谢谢你!
import matplotlib
matplotlib.rcParams['text.usetex'] = True
import numpy as np
import scipy.io as sio

plt.style.use('ggplot')

mat=sio.loadmat('MatlabDaten/absolut.mat')
x=mat['x']
x=x[0]
xaufp=mat['xaufp']
xaufp=xaufp[0]
y=mat['y']
y=y[0]
yaufp=mat['yaufp']
yaufp=yaufp[0]
pfeillaenge=mat['pfeillaenge']
pfeillaenge=pfeillaenge[0]
pfeilpos=mat['pfeilpos']

ppfad=plt.plot(x,y,'C0',label='Geplanter Pfad')
paufp=plt.plot(xaufp,yaufp,'C0o',label='Aufpunkte')
plt.plot(0,0,lw=0,label='Lokale Orientierung')
for count in pfeilpos:
    ppfeil=plt.arrow(count[0],count[1],pfeillaenge[0],pfeillaenge[1], fc='C1', ec='C1', lw = 0.5, head_width=0.05, head_length=0.06, overhang = 0.3, length_includes_head= True, clip_on = False, label='Lokale Orientierung')
plt.xlim(0,5)
plt.ylim(-1.5,1.5)
plt.xlabel('$x$-Koordinate')
plt.ylabel('$y$-Koordinate')
plt.title('Absolute Orientierung')
plt.legend(handles=[ppfad,paufp,ppfeil],loc='lower left')
pfeil=plt.arrow(0.15,-1.32,0.3,0, fc='C1', ec='C1', lw = 0.5, head_width=0.05, head_length=0.06, overhang = 0.3, length_includes_head= True, clip_on = False, label='Lokale Orientierung')
pfeil.set_zorder(+5)
导致的阴谋:
回答 1
Stack Overflow用户
回答已采纳
发布于 2020-03-21 10:59:43
处理此问题的正确方法是创建一个自定义传奇处理程序。以下是基于matplotlib传奇指南的
import matplotlib
matplotlib.rcParams['text.usetex'] = True
import numpy as np
import scipy.io as sio
from matplotlib.legend_handler import HandlerPatch
import matplotlib.patches as mpatches

class HandlerArrow(HandlerPatch):
    def create_artists(self, legend, orig_handle,
                       xdescent, ydescent, width, height, fontsize, trans):
        p = mpatches.FancyArrow(0, 0.5*height, width, 0, length_includes_head=True, head_width=0.75*height )
        self.update_prop(p, orig_handle, legend)
        p.set_transform(trans)
        return [p]


plt.style.use('ggplot')

#mat=sio.loadmat('MatlabDaten/absolut.mat')
#x=mat['x']
#x=x[0]
#xaufp=mat['xaufp']
#xaufp=xaufp[0]
#y=mat['y']
#y=y[0]
#yaufp=mat['yaufp']
#yaufp=yaufp[0]
#pfeillaenge=mat['pfeillaenge']
#pfeillaenge=pfeillaenge[0]
#pfeilpos=mat['pfeilpos']
x = [1,4]
y = [-1,1]
xaufp = [1,4]
yaufp = [-1,1]
pfeilpos = [[1,-1],[4,1]]
pfeillaenge = [0,0.25]

fig = plt.figure()
ppfad=plt.plot(x,y,'C0',label='Geplanter Pfad')
paufp=plt.plot(xaufp,yaufp,'C0o',label='Aufpunkte')
for count in pfeilpos:
    ppfeil=plt.arrow(count[0],count[1],pfeillaenge[0],pfeillaenge[1], fc='C1', ec='C1', lw = 0.5, head_width=0.05, head_length=0.06, overhang = 0.3, length_includes_head= True, clip_on = False, label='Lokale Orientierung')
plt.xlim(0,5)
plt.ylim(-1.5,1.5)
plt.xlabel('$x$-Koordinate')
plt.ylabel('$y$-Koordinate')
plt.title('Absolute Orientierung')

h,l = plt.gca().get_legend_handles_labels()
h.append(ppfeil)
l.append('Lokale Orientierung')
plt.legend(h,l, handler_map={mpatches.FancyArrow : HandlerArrow()})
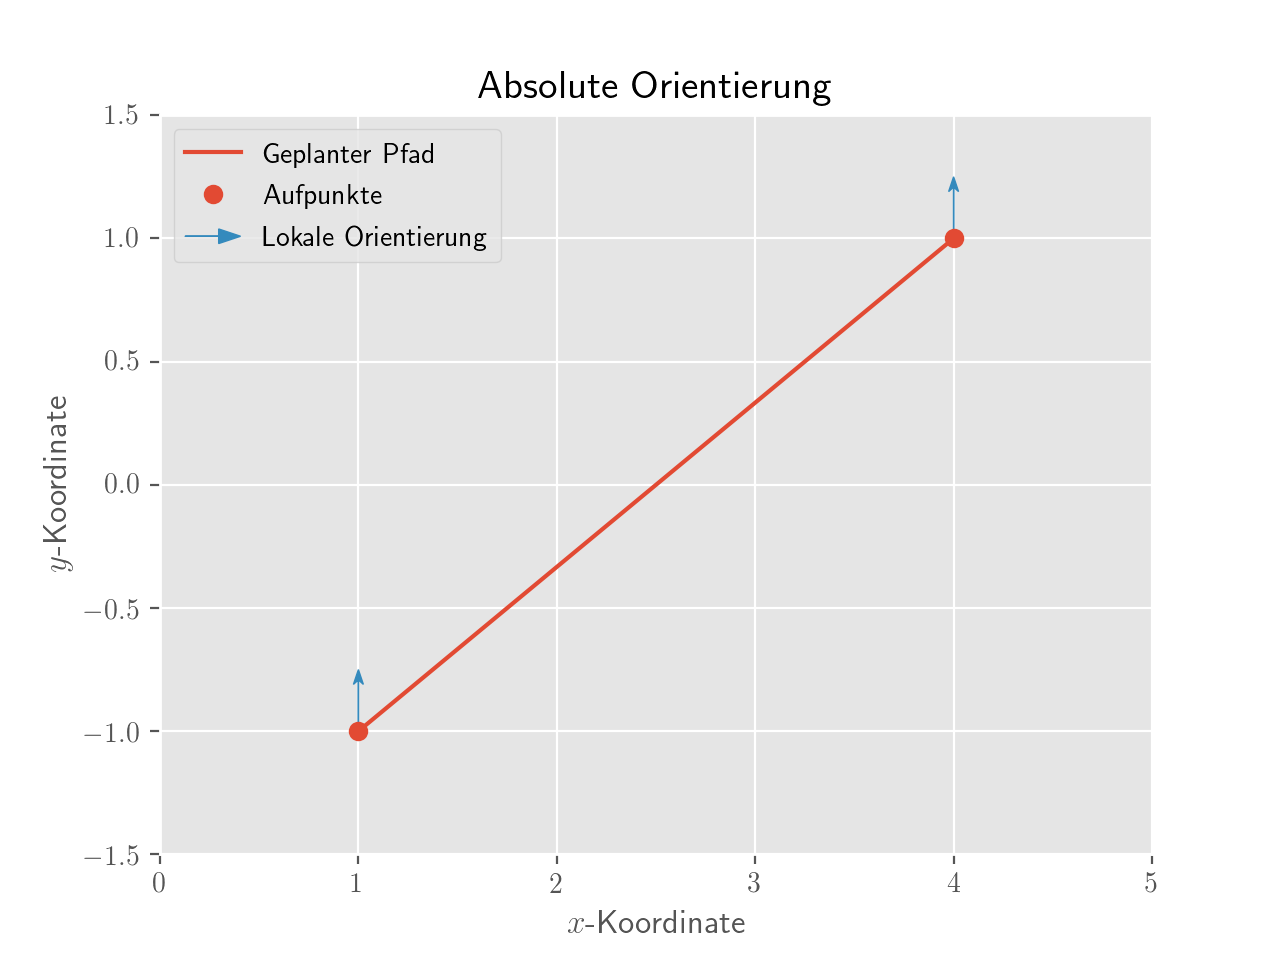
请注意,这通常是过分的,您还可以使用scatter的能力使用自定义标记来欺骗matplotlib:
import matplotlib
matplotlib.rcParams['text.usetex'] = True
import numpy as np
import scipy.io as sio

plt.style.use('ggplot')

#mat=sio.loadmat('MatlabDaten/absolut.mat')
#x=mat['x']
#x=x[0]
#xaufp=mat['xaufp']
#xaufp=xaufp[0]
#y=mat['y']
#y=y[0]
#yaufp=mat['yaufp']
#yaufp=yaufp[0]
#pfeillaenge=mat['pfeillaenge']
#pfeillaenge=pfeillaenge[0]
#pfeilpos=mat['pfeilpos']
x = [1,4]
y = [-1,1]
xaufp = [1,4]
yaufp = [-1,1]
pfeilpos = [[1,-1],[4,1]]
pfeillaenge = [0,0.25]

fig = plt.figure()
ppfad=plt.plot(x,y,'C0',label='Geplanter Pfad')
paufp=plt.plot(xaufp,yaufp,'C0o',label='Aufpunkte')
for count in pfeilpos:
    ppfeil=plt.arrow(count[0],count[1],pfeillaenge[0],pfeillaenge[1], fc='C1', ec='C1', lw = 0.5, head_width=0.05, head_length=0.06, overhang = 0.3, length_includes_head= True, clip_on = False, label='Lokale Orientierung')
plt.scatter([],[],marker=r'$\rightarrow$', label='Lokale Orientierung', color='C1', s=100) # dummy scatter to add an item to the legend
plt.xlim(0,5)
plt.ylim(-1.5,1.5)
plt.xlabel('$x$-Koordinate')
plt.ylabel('$y$-Koordinate')
plt.title('Absolute Orientierung')

plt.legend()

页面原文内容由Stack Overflow提供。腾讯云小微IT领域专用引擎提供翻译支持
原文链接:
https://stackoverflow.com/questions/60781312
复制相关文章
相似问题
腾讯云开发者

Copyright © 2013 - 2026 Tencent Cloud. All Rights Reserved. 腾讯云 版权所有
深圳市腾讯计算机系统有限公司 ICP备案/许可证号:粤B2-20090059 ![]() 粤公网安备44030502008569号
粤公网安备44030502008569号
腾讯云计算(北京)有限责任公司 京ICP证150476号 | 京ICP备11018762号