
如何用gv.Polygons代替gv.Shape成功绘制合唱曲
进一步测试后的
- 更新20/02/20:
我有两个其他形状的文件(一个代表英国的邮政编码地区和一个由Parl选区)。在使用gv.Shape时,我不需要设置用于成功绘图的投影,这与我在最初的文章中讨论的投影不同。我还可以使用gv.Polygons成功地为这些人制作合唱:
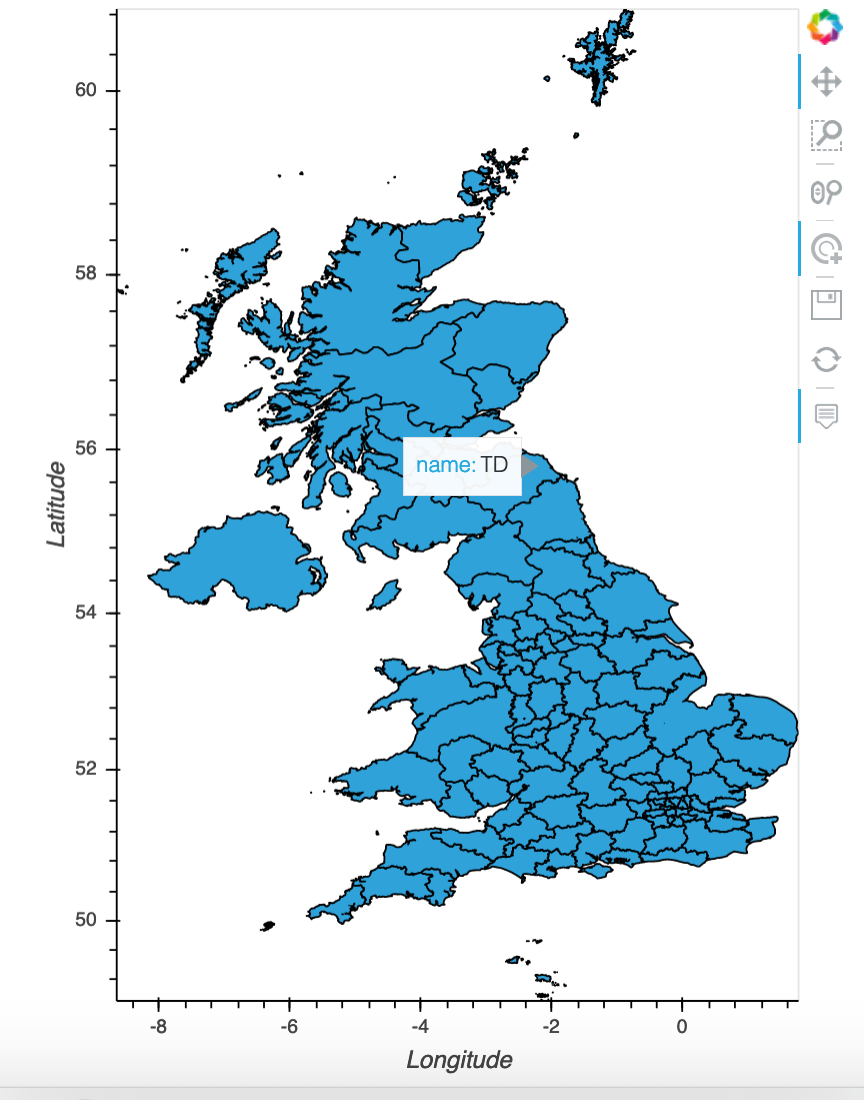
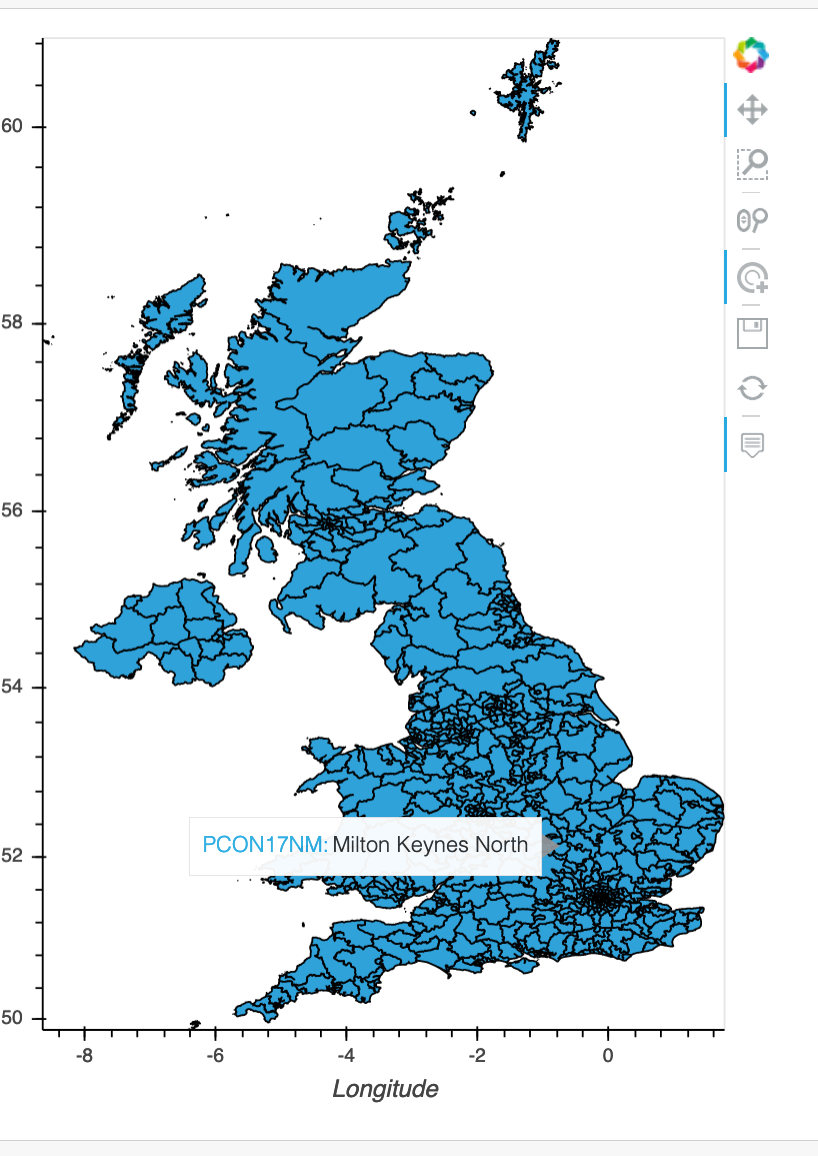
当我检查这些文件所使用的投影时,它是{'init': 'epsg:4326'},因此我更改了lad19 shapefile上的投影,以匹配该投影:
gdf = gdf.to_crs(epsg=4326)
然而,当我试图使用gv.Polygons生成合唱团时,它失败了,其错误与我之前记录的第一个错误相同。
这感觉好像我已经接近解决方案了,有谁有什么建议吗?
- 原始开始:
我下载了这个英国shapefile:https://geoportal.statistics.gov.uk/datasets/local-authority-districts-december-2019-boundaries-uk-buc
我可以使用以下代码(gv.Shape method)成功地创建一个交互式的英国合唱团:
import pandas as pd
import numpy as np
import geopandas as gpd
import random
import copy
import feather
import matplotlib.pyplot as plt
import seaborn as sns
import plotly.graph_objects as go
import plotly.express as px
import panel as pn
import holoviews as hv
import geoviews as gv
import geoviews.feature as gf
import geoviews.tile_sources as gvts
import cartopy
import cartopy.feature as cf
from geoviews import opts
from holoviews import opts, streams
from holoviews.plotting.links import DataLink
from cartopy import crs as ccrs
import hvplot.pandas # noqa
import colorcet as cc
from colorcet.plotting import swatch
sns.set_style()
hv.extension("bokeh","plotly")

# TO SET NUMBER OF ROWS DISPLAYED:
pd.set_option("display.min_rows",0)
# TO SET NUMBER OF COLUMNS DISPLAYED:
pd.set_option("display.max_columns",0)# LOAD SHAPEFILE USING gv.Shape
In [3]: shapefile = "../level3_LAD19_CONTAINS_4_LE
...: VELS_OF_DETAIL/Local_Authority_Districts_December_2019_Boundaries_UK_BUC
...: /Local_Authority_Districts_December_2019_Boundaries_UK_BUC.shp"
...: gv.Shape.from_shapefile(shapefile, crs=ccrs.OSGB())
Out[3]: :Polygons [Longitude,Latitude]
In [4]: # IDENTIFY WHICH ATTRIBUTES ARE IN SHAPEFILE - SO WE KNOW WHICH ATTRIBUTE TO JOIN ON:
   ...: shapes = cartopy.io.shapereader.Reader(shapefile)
   ...: list(shapes.records())[0]
Out[4]: <Record: <shapely.geometry.polygon.Polygon object at 0x1c34bc0550>, {'objectid': 1, 'lad19cd': 'E06000001', 'lad19nm': 'Hartlepool', 'lad19nmw': None, 'bng_e': 447160, 'bng_n': 531474, 'long': -1.27018, 'lat': 54.67614, 'st_areasha': 96845510.24630864, 'st_lengths': 50305.32505760145}, <fields>># LOAD DF THAT CONTAINS ALL 382 UK LOCAL AUTHORITY DISTRICTS:
In [5]: demo_file = pd.read_feather("../stack_overflow_demo_190320.feather")
...: demo_file.head()
Out[5]:
lad19_code lad19_name geography total_population
0 E06000047 County Durham Unitary Authority 526980
1 E06000005 Darlington Unitary Authority 106566
2 E06000001 Hartlepool Unitary Authority 93242
3 E06000002 Middlesbrough Unitary Authority 140545
4 E06000057 Northumberland Unitary Authority 320274# SUCCESSFULLY PLOT UK CHOROPLETH:
In [6]: lad19_heatmap = gv.Shape.from_records(
...: shapes.records(),
...: demo_file,
...: on={"lad19cd":"lad19_code"},
...: value="total_population",
...: index="lad19_name", label = "Local Authority Districts UK Population",
...: crs=ccrs.OSGB()).opts(tools=["hover","tap"],
...: cmap = "Reds", colorbar=True,
...: hover_line_color="blue", hover_alpha=0.2,
...: line_width = 2, show_legend=True,
...: legend_position="top",
...: width = 600, height = 800)
...:
...: lad19_heatmap
Out[6]: :Polygons [Longitude,Latitude] (lad19_name,total_population)
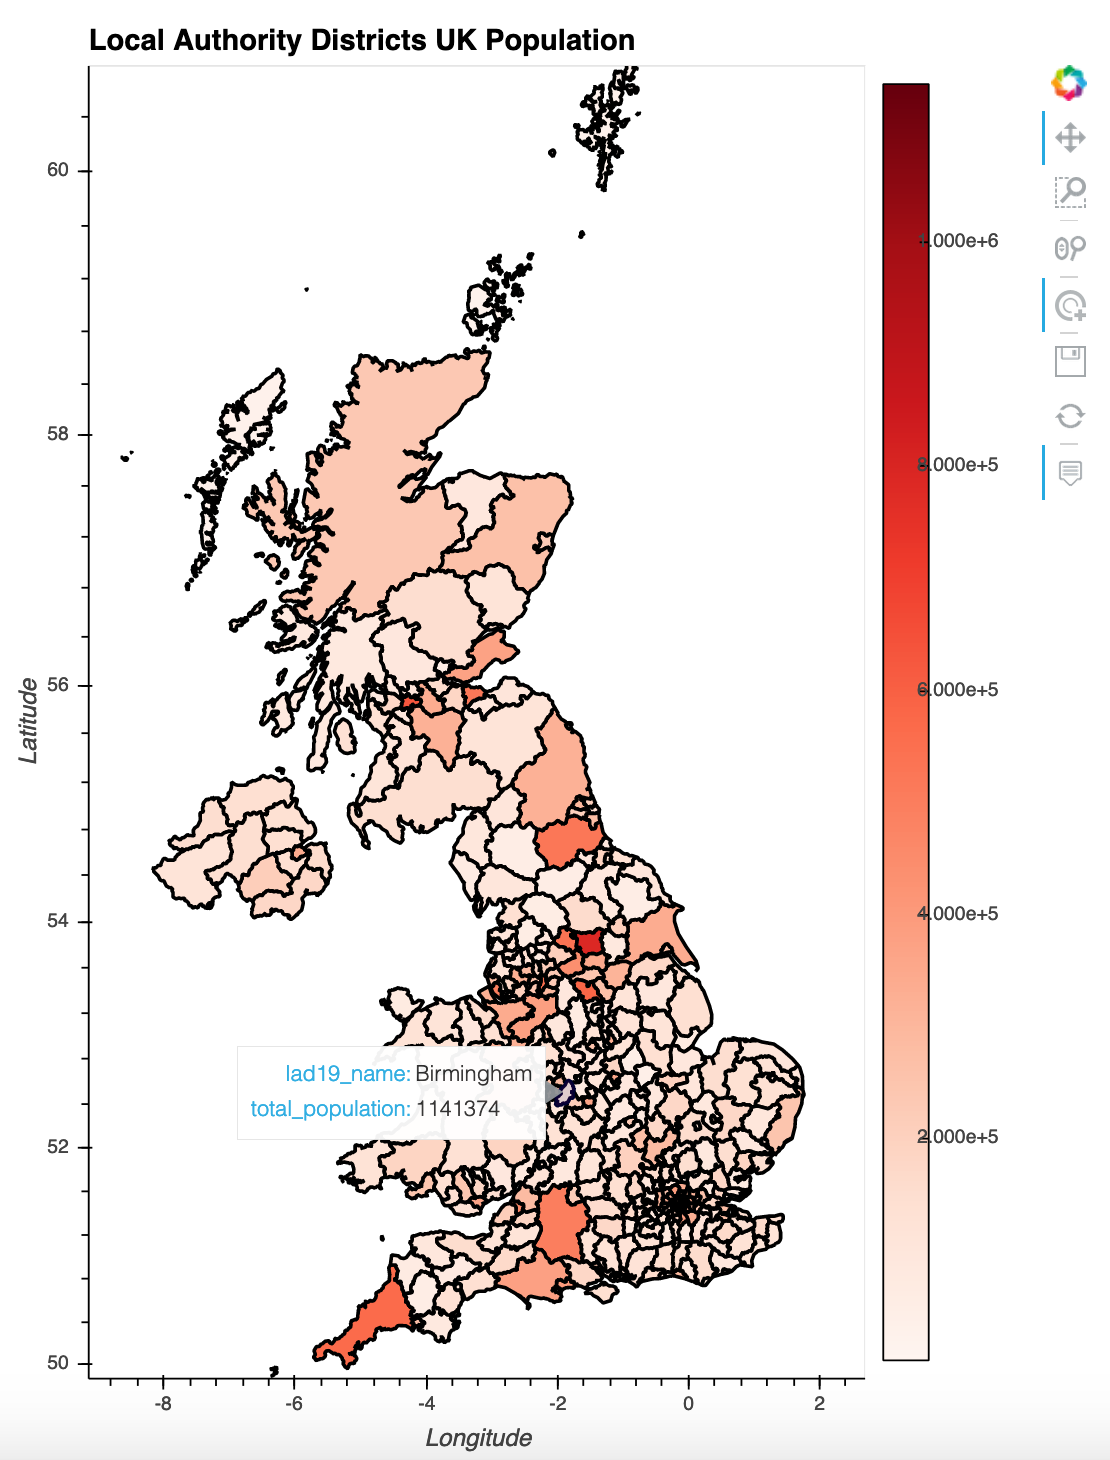
我的问题是,我想转到一个更具交互性的地块上,用户在地图左边选择一个多边形,并为给定的多边形/地方当局区选择一个表格和/或其他一些地块,如:http://holoviews.org/gallery/demos/bokeh/choropleth_data_link.html
要做到这一点,我必须从使用gv.Shape切换到gv.Polygons,无论我尝试什么,我都无法使它成功地工作。
不成功的gv.Polygons方法
# LOAD MY SHAPEFILE AS A GEOPANDAS DATAFRAME:
In [10]: gdf = gpd.read_file("../level3_LAD19_CONTAINS_4_LEVELS_OF_DETAIL/Local_Aut
    ...: hority_Districts_December_2019_Boundaries_UK_BUC/Local_Authority_Districts_December_2019_Boundaries_UK_B
    ...: UC.shp")
    ...: gdf.head()
Out[10]:
   objectid    lad19cd               lad19nm lad19nmw   bng_e   bng_n     long        lat    st_areasha    st_lengths                                           geometry
0         1  E06000001            Hartlepool     None  447160  531474 -1.27018  54.676140  9.684551e+07  50305.325058  POLYGON ((448986.025 536729.674, 453194.600 53...
1         2  E06000002         Middlesbrough     None  451141  516887 -1.21099  54.544670  5.290846e+07  34964.406313  POLYGON ((451752.698 520561.900, 452424.399 52...
2         3  E06000003  Redcar and Cleveland     None  464361  519597 -1.00608  54.567520  2.486791e+08  83939.752513  POLYGON ((451965.636 521061.756, 454348.400 52...
3         4  E06000004      Stockton-on-Tees     None  444940  518183 -1.30664  54.556911  2.071591e+08  87075.860824  POLYGON ((451965.636 521061.756, 451752.698 52...
4 5 E06000005 Darlington None 428029 515648 -1.56835 54.535339 1.988128e+08 91926.839545 POLYGON ((419709.299 515678.298, 419162.998 51...# In the previous step I had no way to specify the projection used, so here I confirm that OSGB is used:
In [11]: gdf.crs
Out[11]: {'init': 'epsg:27700'}我在这里检查了https://spatialreference.org/ref/epsg/osgb-1936-british-national-grid/,这似乎是所需的投影,即OSGB。
# PLOT JUST ON THE GDF (HAS PROJECTION VALUE SET), NOT THE MERGED DF AND GDF
In [12]:gv.Polygons(gdf, vdims='lad1nm'
    ...:            ).opts(projection=ccrs.OSGB(),
    ...:                   tools=['hover','tap'],
    ...:                   width=450, height=600,
    ...:                   color_index='total_population',
    ...:                   colorbar=True
    ...:                  )

DataError: Expected Polygons instance to declare two key dimensions corresponding to the geometry coordinates but 3 dimensions were found which did not refer to any columns.

GeoPandasInterface expects a list of tabular data, for more information on supported datatypes see http://holoviews.org/user_guide/Tabular_Datasets.html
因此,我想我可能需要显式地设置kdim:
# PLOT JUST ON THE GDF, NOT THE MERGED DF AND GDF (HAS PROJECTION VALUE SET)
In [13]: gv.Polygons(gdf, kdims=["long","lat"],vdims='lad1nm'
    ...:            ).opts(projection=ccrs.OSGB(),
    ...:                   tools=['hover','tap'],
    ...:                   width=450, height=600,
    ...:                   color_index='total_population',
    ...:                   colorbar=True
    ...:                  )

DataError: Expected Polygons instance to declare two key dimensions corresponding to the geometry coordinates but 1 dimensions were found which did not refer to any columns.

GeoPandasInterface expects a list of tabular data, for more information on supported datatypes see http://holoviews.org/user_guide/Tabular_Datasets.html
这给了我一个与以前非常相似的错误。
在阅读这些错误信息链接中的用户指南时,它说“表格数据有固定的列标题列表,值存储在任意长的行列表中。电子表格、关系数据库、CSV文件和许多其他典型的数据源自然符合这种格式。”。
我尝试过用一个shapefile创建gdf,从csv和羽毛格式创建demo_file,但都没有成功。
我尝试的最后一件事是将gdf与demo_file df合并,然后再尝试绘制合唱图:
In [15]: # NEED TO MERGE demo_file DF WITH gdf BEFORE PLOTTING POLYGONS:
    ...: finalgdf = gpd.GeoDataFrame(pd.merge(demo_file, gdf, left_on="lad19_code",right_on="lad19cd"))
    ...: finalgdf.drop(columns=["lad19_code","lad19_name"],inplace=True)
    ...: finalgdf.head()
Out[15]:
           geography  total_population  objectid    lad19cd         lad19nm lad19nmw   bng_e   bng_n     long        lat    st_areasha     st_lengths                                           geometry
0  Unitary Authority            526980        45  E06000047   County Durham     None  410381  532242 -1.84050  54.685131  2.231126e+09  264032.927496  POLYGON ((411575.398 556785.301, 413248.799 55...
1  Unitary Authority            106566         5  E06000005      Darlington     None  428029  515648 -1.56835  54.535339  1.988128e+08   91926.839545  POLYGON ((419709.299 515678.298, 419162.998 51...
2  Unitary Authority             93242         1  E06000001      Hartlepool     None  447160  531474 -1.27018  54.676140  9.684551e+07   50305.325058  POLYGON ((448986.025 536729.674, 453194.600 53...
3  Unitary Authority            140545         2  E06000002   Middlesbrough     None  451141  516887 -1.21099  54.544670  5.290846e+07   34964.406313  POLYGON ((451752.698 520561.900, 452424.399 52...
4 Unitary Authority 320274 54 E06000057 Northumberland None 395322 600699 -2.07523 55.300369 5.033705e+09 445104.766524 MULTIPOLYGON (((391123.704 649427.867, 391525....In [18]: gv.Polygons(finalgdf, vdims='lad1nm',
...: ).opts(projection=ccrs.OSGB(),
...: tools=['hover','tap'],
...: width=450, height=600,
...: color_index='total_population',
...: colorbar=True
...: )
DataError: Expected Polygons instance to declare two key dimensions corresponding to the geometry coordinates but 3 dimensions were found which did not refer to any columns.
GeoPandasInterface expects a list of tabular data, for more information on supported datatypes see http://holoviews.org/user_guide/Tabular_Datasets.html但正如你所见,我又犯了同样的错误。
有趣的一点是,当我检查合并finalgdf上使用的投影时,它返回为NoneType:
In [19]: type(finalgdf.crs)
Out[19]: NoneType
所以我把它设置为OSGB:
In [20]: finalgdf.crs = {'init': 'epsg:27700'}
    ...: finalgdf.crs
Out[20]: {'init': 'epsg:27700'}
然后重复了我上一次的阴谋尝试,但是我又犯了同样的错误:
In [21]: gv.Polygons(finalgdf, vdims='lad1nm',
    ...:            ).opts(projection=ccrs.OSGB(),
    ...:                   tools=['hover','tap'],
    ...:                   width=450, height=600,
    ...:                   color_index='total_population',
    ...:                   colorbar=True
    ...:                  )

DataError: Expected Polygons instance to declare two key dimensions corresponding to the geometry coordinates but 3 dimensions were found which did not refer to any columns.

GeoPandasInterface expects a list of tabular data, for more information on supported datatypes see http://holoviews.org/user_guide/Tabular_Datasets.html
我完全迷失了方向。有人能帮我用gv.Polygons而不是gv.Shape成功地再现我的英国合唱团吗?
否则,如果有一种方法可以成功地将使用gv.Shape生成的合唱团链接到数据表和/或http://holoviews.org/gallery/demos/bokeh/choropleth_data_link.html中的其他情节,那就太好了。我也尝试过,但也失败了。
谢谢
我正在使用OSX (10.15.2 (19C57)),firefox 74.0 (64位),我正在使用一本木星笔记本。
软件版本:(试图包括相关的,因为它们不适合他们在这里-如果我错过任何一个,让我知道,我会添加它们)
# Name                    Version                   Build  Channel
_anaconda_depends         2019.03                  py37_0
anaconda                  custom                   py37_1
anaconda-client           1.7.2                    py37_0
anaconda-project          0.8.4                      py_0
arrow-cpp                 0.13.0           py37h8cfbac2_0
bokeh                     1.4.0                    py37_0
cairo                     1.14.12              hc4e6be7_4
cartopy                   0.17.0           py37haea56ea_1
colorcet                  2.0.2                      py_0    pyviz
cython                    0.29.14          py37h0a44026_0
descartes                 1.1.0                      py_4    conda-forge
feather-format            0.4.0                   py_1003    conda-forge
fingertips-py             0.2                      pypi_0    pypi
flask                     1.1.1                      py_0
geopandas                 0.6.1                      py_0
geos                      3.7.1                h0a44026_0
geoviews                  1.6.5                      py_0    pyviz
geoviews-core             1.6.5                      py_0    pyviz
holoviews                 1.12.7                     py_0    pyviz
hvplot                    0.5.2                      py_0    pyviz
ipykernel                 5.1.3            py37h39e3cac_0
ipython                   7.9.0            py37h39e3cac_0
ipython_genutils          0.2.0                    py37_0
ipywidgets                7.5.1                      py_0
jupyter                   1.0.0                    py37_7
jupyter_client            5.3.4                    py37_0
jupyter_console           6.0.0                    py37_0
jupyter_core              4.6.1                    py37_0
jupyterlab                1.2.3              pyhf63ae98_0
jupyterlab_server         1.0.6                      py_0
markdown                  3.1.1                    py37_0
matplotlib                3.1.1            py37h54f8f79_0
notebook                  6.0.2                    py37_0
numpy                     1.17.3           py37h4174a10_0
pandas                    0.25.3           py37h0a44026_0
panel                     0.8.0                      py_0    pyviz
param                     1.9.2                      py_0    pyviz
parquet-cpp               1.5.1                         2    conda-forge
plotly                    4.3.0                      py_0    plotly
plotly_express            0.4.1                      py_0    plotly
proj4                     5.2.0                h0a44026_1
pyarrow                   0.13.0           py37hb37e6aa_0    conda-forge
python                    3.7.5                h359304d_0
scikit-image              0.15.0           py37h0a44026_0
scikit-learn              0.21.3           py37h27c97d8_0
scipy                     1.3.1            py37h1410ff5_0
seaborn                   0.9.0              pyh91ea838_1
shapely 1.6.4 py37he8793f5_0 回答 1
Stack Overflow用户
发布于 2020-03-24 16:52:16
经过进一步的测试,我创建了一个额外的问题,它更简洁地确定了这个错误的原因,更重要的是提供了一个解决方案:
gv.Polygons DataError When Using OSGB Projection
将此问题作为副本结束。
https://stackoverflow.com/questions/60759158
复制相似问题
腾讯云开发者

Copyright © 2013 - 2026 Tencent Cloud. All Rights Reserved. 腾讯云 版权所有
深圳市腾讯计算机系统有限公司 ICP备案/许可证号:粤B2-20090059 ![]() 粤公网安备44030502008569号
粤公网安备44030502008569号
腾讯云计算(北京)有限责任公司 京ICP证150476号 | 京ICP备11018762号