
在seaborn.catplot中求取均值的标准误差
我使用seaborn.catplot和kind='point'绘制我的数据。我希望使用与海运相同的方法计算每个色调var和每个类别的均值(SEM)的标准误差,以确保我的计算值与绘制的错误条完全匹配。计算SEM和95%置信区间(CIs)的默认解决方案包含一个引导算法,其中平均值被引导1000次以计算SEM/CIs。在earlier post中,我看到了一种可能为此提供函数的方法(使用seaborn.utils.ci()和seaborn.algorithms.bootstrap()等海运源代码函数),但我不知道如何实现它。由于引导使用随机抽样,还需要确保生成相同的1000个方法阵列,用于绘图和获取扫描电镜。
下面是一个代码示例:
import numpy as np
import pandas as pd
import seaborn as sns

# simulate data
rng = np.random.RandomState(42)
measure_names = np.tile(np.repeat(['Train BAC','Test BAC'],10),2)
model_numbers = np.repeat([0,1],20)
measure_values = np.concatenate((rng.uniform(low=0.6,high=1,size=20),
                                rng.uniform(low=0.5,high=0.8,size=20)
                                ))
folds=np.tile([1,2,3,4,5,6,7,8,9,10],4)

plot_df = pd.DataFrame({'model_number':model_numbers,
                        'measure_name':measure_names,
                        'measure_value':measure_values,
                        'outer_fold':folds})

# plot data as pointplot
g = sns.catplot(x='model_number',
                y='measure_value',
                hue='measure_name',
                kind='point',
                seed=rng,
                data=plot_df)
它产生:
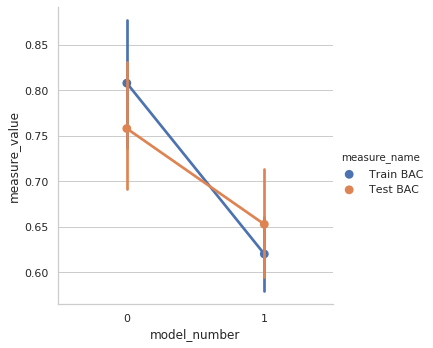
我想获得扫描电镜的所有培训和测试成绩为两种模式。这就是:
# obtain SEM for each score in each model using the same method as in sns.catplot
model_0_train_bac = plot_df.loc[((plot_df['model_number'] == 0) & (plot_df['measure_name'] == 'Train BAC')),'measure_value']
model_0_test_bac = plot_df.loc[((plot_df['model_number'] == 0) & (plot_df['measure_name'] == 'Test BAC')),'measure_value']
model_1_train_bac = plot_df.loc[((plot_df['model_number'] == 1) & (plot_df['measure_name'] == 'Train BAC')),'measure_value']
model_1_test_bac = plot_df.loc[((plot_df['model_number'] == 1) & (plot_df['measure_name'] == 'Test BAC')),'measure_value']回答 1
Stack Overflow用户
发布于 2020-03-12 15:37:38
我不知道你是否要求你取同样的样品。根据定义,引导是通过随机抽样来工作的,因此,从一次运行到下一次运行会有一些可变性(除非我弄错了)。
您可以按照海运所做的相同的方式计算CI:
# simulate data
rng = np.random.RandomState(42)
measure_names = np.tile(np.repeat(['Train BAC','Test BAC'],10),2)
model_numbers = np.repeat([0,1],20)
measure_values = np.concatenate((rng.uniform(low=0.6,high=1,size=20),
                                rng.uniform(low=0.5,high=0.8,size=20)
                                ))
folds=np.tile([1,2,3,4,5,6,7,8,9,10],4)

plot_df = pd.DataFrame({'model_number':model_numbers,
                        'measure_name':measure_names,
                        'measure_value':measure_values,
                        'outer_fold':folds})

x_col = 'model_number'
y_col = 'measure_value'
hue_col = 'measure_name'
ci = 95
est = np.mean
n_boot = 1000

for gr,temp_df in plot_df.groupby([hue_col,x_col]):
    print(gr,est(temp_df[y_col]), sns.utils.ci(sns.algorithms.bootstrap(temp_df[y_col], func=est,
                                          n_boot=n_boot,
                                          units=None,
                                          seed=rng)))
这就意味着:
('Test BAC', 0) 0.7581071363371585 [0.69217109 0.8316217 ]
('Test BAC', 1) 0.6527812067134964 [0.59523784 0.71539669]
('Train BAC', 0) 0.8080546943810699 [0.73214414 0.88102816]
('Train BAC', 1) 0.6201161718490218 [0.57978654 0.66241543]
请注意,如果第二次运行循环,您将得到类似的CIs,但不完全相同。
如果您真的希望通过海运获得绘图中使用的确切值(请再次注意,如果再次绘制相同的数据,这些值将略有不同),那么您可以直接从用于绘制错误条的Line2D艺术家中提取这些值:
g = sns.catplot(x=x_col,
                y=y_col,
                hue=hue_col,
                kind='point',
                ci=ci,
                estimator=est,
                n_boot=n_boot,
                seed=rng,
                data=plot_df)
for l in g.ax.lines:
    print(l.get_data())
产出:
(array([0., 1.]), array([0.80805469, 0.62011617]))
(array([0., 0.]), array([0.73203808, 0.88129836])) # <<<<
(array([1., 1.]), array([0.57828366, 0.66300033])) # <<<<
(array([0., 1.]), array([0.75810714, 0.65278121]))
(array([0., 0.]), array([0.69124145, 0.83297914])) # <<<<
(array([1., 1.]), array([0.59113739, 0.71572469])) # <<<<https://stackoverflow.com/questions/60654248
复制相似问题
腾讯云开发者

Copyright © 2013 - 2026 Tencent Cloud. All Rights Reserved. 腾讯云 版权所有
深圳市腾讯计算机系统有限公司 ICP备案/许可证号:粤B2-20090059 ![]() 粤公网安备44030502008569号
粤公网安备44030502008569号
腾讯云计算(北京)有限责任公司 京ICP证150476号 | 京ICP备11018762号