
如何为地图中的每个人口普查区增加更多的数据?
我用tidycensus和tigris.编制了一个县的普查区地图(显示所有的普查区)。在一个名为demography的单独数据文件中有一些数据,其中包含4列county、tract、x.foreclosure_filing和delinquent_parcels。
如何创建仅包含在demography (仅19域)数据块中的那些域的映射,并显示x.foreclosure_filing的值,以及映射中这些(19)域的delinquent_parcels值?
人口学数据显示如下:
County      tract           X.foreclosure_filings   delinquent_parcels
1 Cuyahoga 1401.00                     8              13.52
2 Cuyahoga 1403.01                    18              22.25
3 Cuyahoga 1403.02                    18              11.96
4 Cuyahoga 1404.00                    19               8.44
5 Cuyahoga 1405.00                    27              10.93
6 Cuyahoga 1407.01                    17              13.77
码
library(tidycensus)
library(tidyverse)
options(tigris_use_cache = TRUE)


clevelandhts <- get_acs(state = "OH", county = "Cuyahoga", geography = "tract",
                        variables = "B19013_001", geometry = TRUE)

View(clevelandhts)
clevelandhts %>%
  ggplot(aes(fill = estimate)) +
  geom_sf(color = NA) +
  coord_sf(crs = 26917) +
scale_fill_viridis_c(option = "magma")回答 1
Stack Overflow用户
发布于 2020-02-28 17:00:44
您可以使用fuzzy_join将两个数据框架合并在一起,与str_detect一起查找包含在NAME in clevelandhts中的demography中的普查域字符串。若要将地图中不同列的信息作为标签包括在内,请使用geom_sf_label。
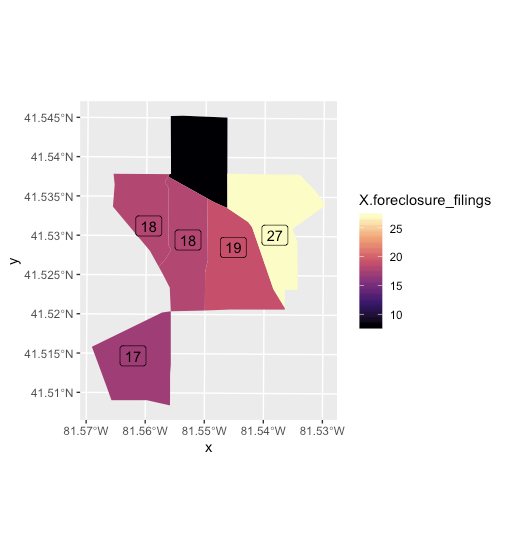
编辑:填充颜色现在基于X.foreclosure_filings。
library(tidycensus)
library(tidyverse)
library(fuzzyjoin)

options(tigris_use_cache = TRUE)

demography$tract <- as.character(demography$tract)

census_api_key("XXXXXXXXXXXXXXXXXXXXXXXXXXXXXXXXXXXXXXXXX")

clevelandhts <- get_acs(state = "OH", county = "Cuyahoga", geography = "tract",
                        variables = "B19013_001", geometry = TRUE)

clevelandhts %>%
  fuzzy_join(demography, by = c("NAME" = "tract"), match_fun = str_detect) %>%
  ggplot(aes(fill = X.foreclosure_filings)) +
  geom_sf(color = NA) +
  coord_sf(crs = 26917) +
  scale_fill_viridis_c(option = "magma") +
  geom_sf_label(aes(label = X.foreclosure_filings))
图
数据
demography <- read.table(
  text = "County      tract           X.foreclosure_filings   delinquent_parcels
 Cuyahoga 1401.00                     8              13.52
 Cuyahoga 1403.01                    18              22.25
 Cuyahoga 1403.02                    18              11.96
 Cuyahoga 1404.00                    19               8.44
 Cuyahoga 1405.00                    27              10.93
 Cuyahoga 1407.01                    17              13.77", header = T)
编辑(2/29/20)
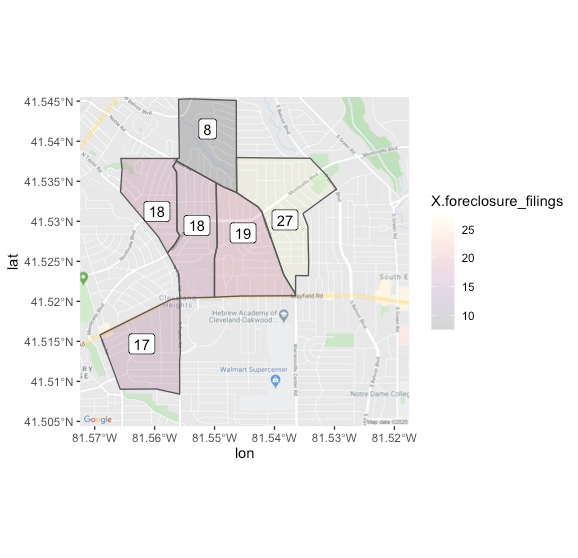
要在下面添加街道地图,您可以执行以下操作。
在本例中,我在输入API键后使用Google街道地图。此示例的位置参数是特定的,但是在与clevelandhts表连接后可以从demography获得框界。再说一遍,这只是一个演示。如果你需要进一步的帮助,我鼓励你单独提出一个问题。
# Requires Google API key
county_map <- get_map(location = c(-81.57,41.49,-81.52,41.56), maptype = "roadmap", source = "google")

full_data <- fuzzy_join(clevelandhts, demography, by = c("NAME" = "tract"), match_fun = str_detect)

ggmap(county_map) +
  geom_sf(data = full_data, inherit.aes = FALSE, aes(fill = X.foreclosure_filings)) +
  scale_fill_viridis_c(option = "magma", alpha = .2) +
  geom_sf_label(data = full_data, aes(label = X.foreclosure_filings), inherit.aes = FALSE)
https://stackoverflow.com/questions/60444934
复制相似问题
腾讯云开发者

Copyright © 2013 - 2026 Tencent Cloud. All Rights Reserved. 腾讯云 版权所有
深圳市腾讯计算机系统有限公司 ICP备案/许可证号:粤B2-20090059 ![]() 粤公网安备44030502008569号
粤公网安备44030502008569号
腾讯云计算(北京)有限责任公司 京ICP证150476号 | 京ICP备11018762号