
正确关闭功能调用后使用的Tkinter
现在,我使用Tkinter作为前端框架来显示通过队列输入的数据。然后,使用()函数将这些数据绘制到屏幕上,等等。
循环部分使用Tkinters函数,该函数在n毫秒后调用特定函数。我有一种感觉,当呼叫破坏或只是关闭窗口,这个循环停止?导致某些后端进程不满意。
我已经发布了下面的代码,因为您将错过抽象类。删除init中的(Updater)和超级程序将满足它,因为抽象类更像一个接口。
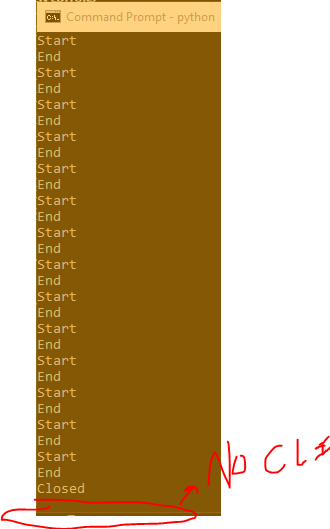
复制该问题:在脚本运行时,如果Tkinter窗口在将队列中的所有数据绘制到绘图图之前以任何可用的方式关闭,则为。脚本永远不会返回到命令行,并且永远被卡住。这种情况是不利的,因为能够退出窗口,并期待进程被摧毁是我正在寻找的。
进一步跟踪:在没有通过oscy.run()时,程序会迅速退出,但不会返回到命令行;正如在完成之前运行和快速退出程序所看到的那样。这开始暗示在init中发生了一些事情。
from __future__ import division

import logging

import atexit
import matplotlib
import numpy as np
matplotlib.use('TkAgg')

from functools import wraps
from matplotlib.backends.backend_tkagg import FigureCanvasTkAgg
from Tkinter import Scale, Button, Tk, TOP, BOTTOM, BOTH, HORIZONTAL


class Oscilloscope():
    """ Displays the Oscilloscope provided the data streaming in. """
    def __init__(
        self,
        data_queue,
        closed_callback,
        title="DRP",
        xlabel="Range Cells",
        ylabel="Magnitude"
    ):
        """
        Initialization function for the Osc oscilloscope.
        :param data_queue: List data representative of magnitudes per update.
        :type data_queue: Queue
        :param closed_callback: When the figure is closed, callback should be used to remove the figure.
        :type closed_callback: Function
        :param title: Title of the plot being drawn for the Oscilloscope.
        :type title: String
        :param xlabel: X-axis of the plot being drawn, should either be Range or Doppler.
        :type xlabel: String
        :param ylabel: Y-axis of the plot being drawn, should always be Magnitude.
        :type ylabel: String
        """

        self.data_queue = data_queue
        self.closed_callback = closed_callback

        self.window = Tk()
        atexit.register(self.closed_callback)

        self.title = title
        self.xlabel = xlabel
        self.ylabel = ylabel

        self.y_limits = np.array([0, np.finfo(np.float).eps])

    def _adjust_ylim_if_req(self, magnitude):
        """
        Changes the limits based on magnitudes.
        :param magnitude: Size of the magnitude being plotted.
        :type magnitude: Float
        """
        if magnitude < self.y_limits[0]:
            self.y_limits[0] = magnitude
        elif magnitude > self.y_limits[1]:
            self.y_limits[1] = magnitude
        self.ax.set_ylim(self.y_limits[0], self.y_limits[1])

    def draw(self):
        """
        Draws the main line plot.
        """
        try:
            magnitudes = self.data_queue.get_nowait()
        except:
            pass
        else:
            # Adjust y limits
            for magnitude in magnitudes:
                self._adjust_ylim_if_req(magnitude)
            # Plot the graph
            self.ax.cla()
            self.ax.set_title(self.title, fontdict={'fontsize': 16, 'fontweight': 'medium'})
            self.ax.set_xlabel(self.xlabel, fontdict={'fontsize': 12, 'fontweight': 'medium'})
            self.ax.set_ylabel(self.ylabel, fontdict={'fontsize': 12, 'fontweight': 'medium'})
            self.ax.plot([n for n in range(len(magnitudes))], magnitudes, '-bo')

    def run(self):
        """
        Sets up and runs the main logic of the Window
        """
        self.plot()
        self.updateplot()
        self.window.mainloop()

    def plot(self):
        """
        Creates the initial base plot
        """
        figure = matplotlib.figure.Figure()
        self.ax = figure.add_subplot(1,1,1)
        self.ax.set_title(self.title, fontdict={'fontsize': 16, 'fontweight': 'medium'})
        self.ax.set_xlabel(self.xlabel, fontdict={'fontsize': 12, 'fontweight': 'medium'})
        self.ax.set_ylabel(self.ylabel, fontdict={'fontsize': 12, 'fontweight': 'medium'})
        self.canvas = FigureCanvasTkAgg(figure, master=self.window)
        self.canvas.draw()
        self.canvas.get_tk_widget().pack(side=TOP, fill=BOTH, expand=1)
        self.canvas._tkcanvas.pack(side=TOP, fill=BOTH, expand=1)

        self.draw()

        def close_fig():
            self.window.destroy()
            self.closed_callback
        button = Button(self.window, text='Close', command=close_fig)
        button.pack()

    def updateplot(self):
        """
        Updates the plot by gathering more data from the Queue.
        """
        print('Start')
        self.draw()
        self.canvas.draw()
        self.window.after(1, self.updateplot)
        print('End')

if __name__ == '__main__':
    from threading import Thread
    from multiprocessing import Queue
    q = Queue()
    for i in xrange(100):
        l = []
        for i in xrange(1000):
            l.append(np.random.randint(0, 100))
        q.put(l)
    def cb():
        print('Closed')
    oscy = Oscilloscope(q, cb)
    oscy.run()
回答 1
Stack Overflow用户
发布于 2019-10-22 19:25:48
这是一个非常奇怪的问题,我永远不会想到。
溶液
使用multiprocessing.Queue是问题所在,要解决这个问题,请使用常规队列。
发生了什么
多处理队列似乎通过管道输入它的数据。当程序终止并且main的范围丢失时,这些数据仍然被保存,等待被删除。这将导致“挂起”,即什么都没有发生,但背景中正在发生一些事情。
How to clear a multiprocessing queue in python
在程序执行之前调用close()可以解决这个问题。由于多处理模块本身就是一个基于进程的“线程”接口。
https://stackoverflow.com/questions/58510283
复制相似问题
腾讯云开发者

Copyright © 2013 - 2026 Tencent Cloud. All Rights Reserved. 腾讯云 版权所有
深圳市腾讯计算机系统有限公司 ICP备案/许可证号:粤B2-20090059 ![]() 粤公网安备44030502008569号
粤公网安备44030502008569号
腾讯云计算(北京)有限责任公司 京ICP证150476号 | 京ICP备11018762号