
延迟呼叫应该放置在一个gekko代码中吗?
延迟呼叫应该放置在一个gekko代码中吗?
提问于 2019-10-08 13:25:44
我试图使用GEKKO来控制坦克的水平,同时控制进气流量。我想将GEKKO控制器建模为FOPDT。我得到了我需要的所有参数,但是我想用延迟函数来解释时间延迟。我不确定这个函数的确切位置,因为当我把它放在代码中时,它给了我一个错误。当我删除它(即没有时间延迟)时,代码可以正常工作,但我想要更现实一些,并放置一个时间延迟。以下是附随的代码:
import numpy as np
import matplotlib.pyplot as plt
from scipy.integrate import odeint
from gekko import GEKKO

# Steady State Initial Condition
u2_ss=10.0

h_ss=50.0

x0 = np.empty(1)
x0[0]= h_ss

#%% GEKKO nonlinear MPC
m = GEKKO(remote=False)
m.time = [0,0.02,0.04,0.06,0.08,0.1,0.12,0.15,0.2]

Ac=30.0
# initial conditions

h0=50.0
q0=10.0
Kp=93.48425357240352
taup=1010.8757590561246
thetap= 3
m.q=m.MV(value=q0,lb=0,ub=100)
m.h= m.CV(value=h0)

m.delay(m.q,m.h,thetap)

m.Equation(taup * m.h.dt()==m.q*Kp -m.h)


#MV tuning
m.q.STATUS = 1
m.q.FSTATUS = 0
m.q.DMAX = 100


#CV tuning

m.h.STATUS = 1
m.h.FSTATUS = 1
m.h.TR_INIT = 2
m.h.TAU = 1.0
m.h.SP = 55.0

m.options.CV_TYPE = 2
m.options.IMODE = 6
m.options.SOLVER = 3

#%% define CSTR model
def cstr(x,t,u2,Ac):

    q=u2
    Ac=30.0


    # States (2):
    # the height of the tank (m)

    h=x[0]

    # Parameters:


    # Calculate height derivative

    dhdt=(q-5)/Ac

    # Return xdot:
    xdot = np.zeros(1)
    xdot[0]= dhdt
    return xdot


# Time Interval (min)
t = np.linspace(0,20,400)

# Store results for plotting


hsp=np.ones(len(t))*h_ss
h=np.ones(len(t))*h_ss

u2 = np.ones(len(t)) * u2_ss


# Set point steps

hsp[0:100] = 55.0
hsp[100:]=70.0


# Create plot
plt.figure(figsize=(10,7))
plt.ion()
plt.show()

# Simulate CSTR
for i in range(len(t)-1):
    # simulate one time period (0.05 sec each loop)
    ts = [t[i],t[i+1]]
    y = odeint(cstr,x0,ts,args=(u2[i],Ac))

    # retrieve measurements

    h[i+1]= y[-1][0]

    # insert measurement

    m.h.MEAS=h[i+1]

    m.h.SP=hsp[i+1]


    # solve MPC
    m.solve(disp=True)


    # retrieve new q value

    u2[i+1] = m.q.NEWVAL
    # update initial conditions
    x0[0]= h[i+1]

    #%% Plot the results

    plt.clf()
    plt.subplot(2,1,1)
    plt.plot(t[0:i],u2[0:i],'b--',linewidth=3)
    plt.ylabel('inlet flow')

    plt.subplot(2,1,2)

    plt.plot(t[0:i],hsp[0:i],'g--',linewidth=3,label=r'$h_{sp}$')
    plt.plot(t[0:i],h[0:i],'k.-',linewidth=3,label=r'$h_{meas}$')
    plt.xlabel('time')
    plt.ylabel('tank level')
    plt.legend(loc='best')


    plt.draw()
plt.pause(0.01)回答 1
Stack Overflow用户
回答已采纳
发布于 2019-10-10 12:07:11
您的模型的问题是,微分方程和延迟模型正试图根据m.h值求解m.q值。这两个方程不能同时满足。延迟对象要求m.h是3个周期前m.q的延迟版本。微分方程要求线性微分方程的解。它们不会为m.h提供相同的答案,因此这将导致一个不可行的解决方案,正如求解者正确报告的那样。
m.delay(m.q,m.h,thetap)
m.Equation(taup * m.h.dt()==m.q*Kp -m.h)相反,您应该创建一个新变量,如m.qd,作为m.q的延迟版本。然后,m.dq是微分方程的输入。
m.qd=m.Var()
m.delay(m.q,m.qd,thetap)
m.Equation(taup * m.h.dt()==m.qd*Kp -m.h)其他问题,与问题无关
你的申请还有另外几个问题。
- 模拟器和控制器之间的时间同步是不正确的。对于模拟器和控制器,您应该使用相同的周期时间。我将模拟时间改为
t = np.linspace(0,20,201),周期为0.1分钟。 - 时滞模型要求控制器具有均匀的时间间隔,因为它是一个离散模型。我将控制器时间间隔更改为
m.time = np.linspace(0,2,21)或0.1min,用于循环时间。 - 仿真器(用ODEINT解决)不存在输入延迟,因此控制器与仿真器之间存在模型失配。这仍然可以,因为这是一个现实的场景,有模型错配,但您将需要认识到,将有一些纠正控制行动的基础上,从模拟器反馈。该控制器能够将电平驱动到设定点,但由于模型失配和平方误差目标,MV中存在抖动。
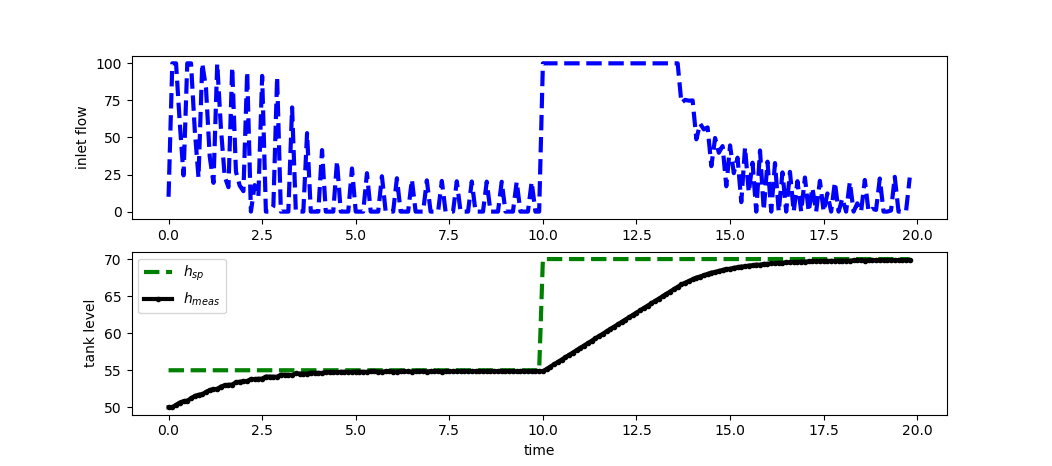
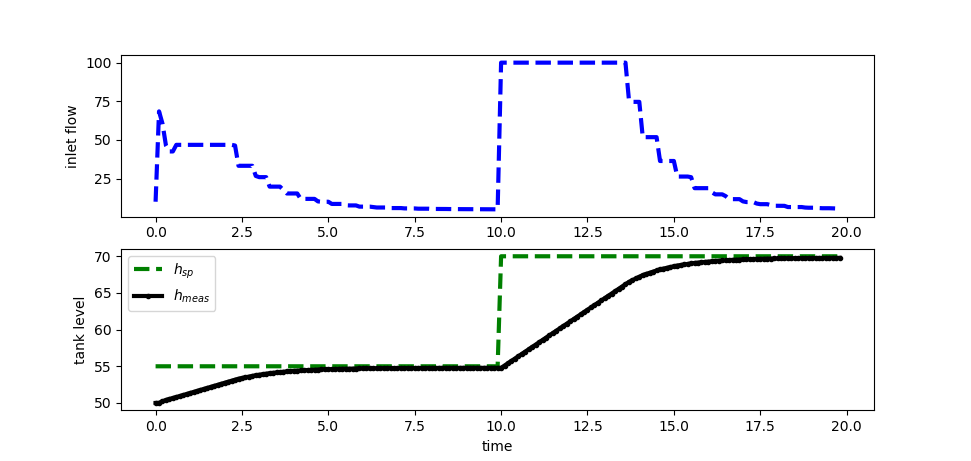
为了改善颤振,我切换到m.options.CV_TYPE=1,设置了一个SPHI和SPLO死区,用m.options.TR_OPEN=50打开了初始轨迹,并使用m.q.DCOST添加了移动抑制。这些都有取得类似性能的效果,但没有阀门颤振。
以下是源代码:
import numpy as np
import matplotlib.pyplot as plt
from scipy.integrate import odeint
from gekko import GEKKO

# Steady State Initial Condition
u2_ss=10.0
h_ss=50.0
x0 = np.empty(1)
x0[0]= h_ss

#%% GEKKO nonlinear MPC
m = GEKKO(remote=False)
m.time = np.linspace(0,2,21)
Ac=30.0
# initial conditions
h0=50.0
q0=10.0
Kp=93.48425357240352
taup=1010.8757590561246
thetap= 3
m.q=m.MV(value=q0,lb=0,ub=100)
m.qd=m.Var(value=q0)
m.h= m.CV(value=h0)
m.delay(m.q,m.qd,thetap)
m.Equation(taup * m.h.dt()==m.qd*Kp -m.h)

#MV tuning
m.q.STATUS = 1
m.q.FSTATUS = 0
m.q.DMAX = 100
m.q.DCOST = 1

#CV tuning
m.h.STATUS = 1
m.h.FSTATUS = 1
m.h.TR_INIT = 1
m.h.TR_OPEN = 50
m.h.TAU = 0.5

m.options.CV_TYPE = 1
m.options.IMODE = 6
m.options.SOLVER = 3

#%% define CSTR model
def cstr(x,t,u2,Ac):
    q=u2
    Ac=30.0

    # States (2):
    # the height of the tank (m)
    h=x[0]

    # Parameters:
    # Calculate height derivative
    dhdt=(q-5)/Ac

    # Return xdot:
    xdot = np.zeros(1)
    xdot[0]= dhdt
    return xdot

# Time Interval (min)
t = np.linspace(0,20,201)

# Store results for plotting
hsp=np.ones(len(t))*h_ss
h=np.ones(len(t))*h_ss
u2 = np.ones(len(t)) * u2_ss

# Set point steps
hsp[0:100] = 55.0
hsp[100:]  = 70.0

# Create plot
plt.figure(figsize=(10,7))
plt.ion()
plt.show()

# Simulate CSTR
for i in range(len(t)-1):
    # simulate one time period (0.05 sec each loop)
    ts = [t[i],t[i+1]]
    y = odeint(cstr,x0,ts,args=(u2[i],Ac))

    # retrieve measurements
    h[i+1]= y[-1][0]

    # insert measurement
    m.h.MEAS=h[i+1]
    # for CV_TYPE = 1
    m.h.SPHI=hsp[i+1]+0.05
    m.h.SPLO=hsp[i+1]-0.05
    # for CV_TYPE = 2
    m.h.SP=hsp[i+1]

    # solve MPC
    m.solve(disp=False)

    # retrieve new q value
    u2[i+1] = m.q.NEWVAL
    # update initial conditions
    x0[0]= h[i+1]

    #%% Plot the results
    plt.clf()
    plt.subplot(2,1,1)
    plt.plot(t[0:i],u2[0:i],'b--',linewidth=3)
    plt.ylabel('inlet flow')

    plt.subplot(2,1,2)
    plt.plot(t[0:i],hsp[0:i],'g--',linewidth=3,label=r'$h_{sp}$')
    plt.plot(t[0:i],h[0:i],'k.-',linewidth=3,label=r'$h_{meas}$')
    plt.xlabel('time')
    plt.ylabel('tank level')
    plt.legend(loc='best')

    plt.draw()
plt.pause(0.01)页面原文内容由Stack Overflow提供。腾讯云小微IT领域专用引擎提供翻译支持
原文链接:
https://stackoverflow.com/questions/58287318
复制相关文章
相似问题
腾讯云开发者

Copyright © 2013 - 2026 Tencent Cloud. All Rights Reserved. 腾讯云 版权所有
深圳市腾讯计算机系统有限公司 ICP备案/许可证号:粤B2-20090059 ![]() 粤公网安备44030502008569号
粤公网安备44030502008569号
腾讯云计算(北京)有限责任公司 京ICP证150476号 | 京ICP备11018762号