
填充面积在geom_bspline()下?
填充面积在geom_bspline()下?
提问于 2019-10-07 01:05:20
我明白geom_area是如何用来填充直线下的区域的。如何填充曲线下的区域,如geom_bspline创建的曲线
library("tidyverse")
library("ggforce")

dftest <- tibble(
  x = c(1, 2, 3, 4, 5),
  y = c(10, 15, 30, 80, 5)
)

# Fill area under straight lines - OK
ggplot(dftest, aes(x = x, y = y)) +
  geom_point() +
  geom_line() +
  geom_area(alpha = 0.3)

# Fill area under curve ???
ggplot(dftest, aes(x = x, y = y)) +
  geom_point() +
geom_bspline() 回答 1
Stack Overflow用户
回答已采纳
发布于 2019-10-07 06:08:26
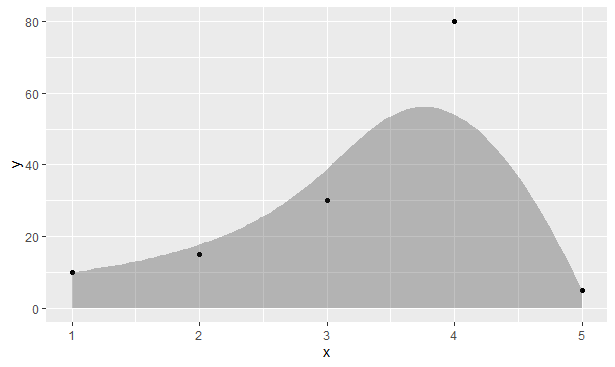
您可以使用stat与区域geom配对:
ggplot(dftest, aes(x = x, y = y)) +
  geom_point() +
  stat_bspline(geom = "area", alpha = 0.3)
页面原文内容由Stack Overflow提供。腾讯云小微IT领域专用引擎提供翻译支持
原文链接:
https://stackoverflow.com/questions/58262453
复制相关文章
相似问题
腾讯云开发者

Copyright © 2013 - 2026 Tencent Cloud. All Rights Reserved. 腾讯云 版权所有
深圳市腾讯计算机系统有限公司 ICP备案/许可证号:粤B2-20090059 ![]() 粤公网安备44030502008569号
粤公网安备44030502008569号
腾讯云计算(北京)有限责任公司 京ICP证150476号 | 京ICP备11018762号