
唐纳德·特朗普( D3 V4 )在美国地图上正确放置泡沫
我正在创建一个美国地图,我有一系列的实际坐标在美国的一些地方。我想在地图上把一个点或一个气泡放在正确的位置。我如何缩放/翻译这些?
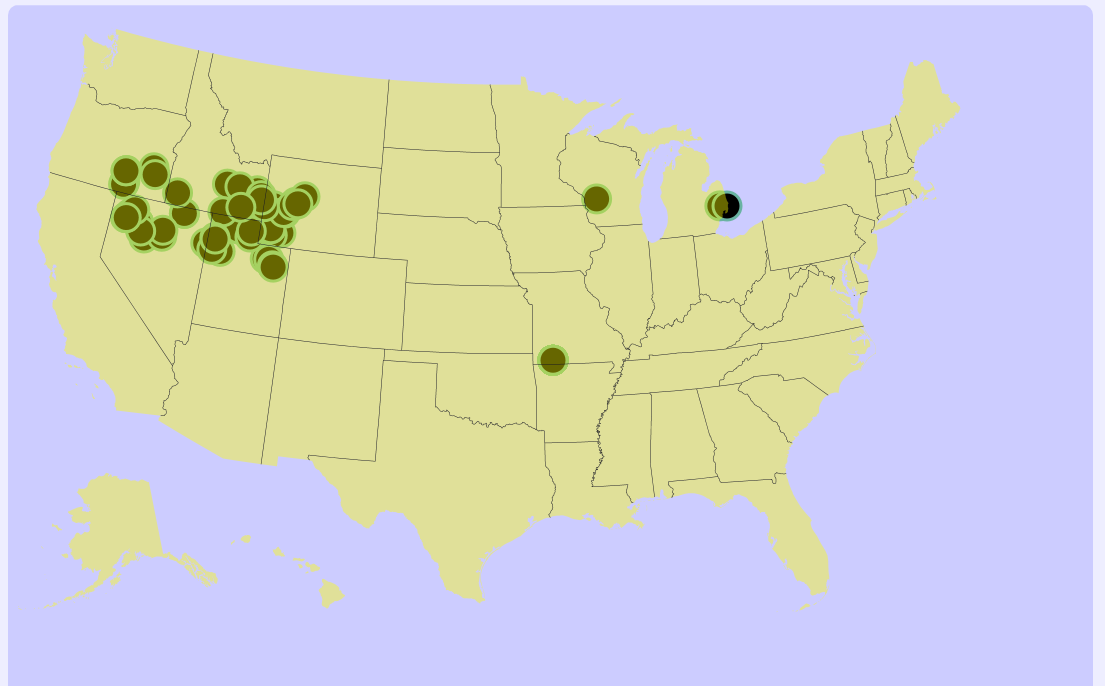
我得到的是:
我试过的是:
function USAPlot(divid, data) {

    var margin = { top: 20, right: 20, bottom: 30, left: 50 },
        width = 1040 - margin.left - margin.right,
        height = 700 - margin.top - margin.bottom;

    // formatting the data
    data.forEach(function (d) {
        d.loc = d.location;
        d.count = d.count;
        d.lat = d.latitude;
        d.lon = d.longitude;
    });

    var svg = d3.select(divid)
        .append("svg")
        .attr("width", width + margin.left + margin.right)
        .attr("height", height + margin.top + margin.bottom)
        ;
    var path = d3.geoPath();
    var projection = d3.geoMercator()
        .scale(200)
        .translate([margin.left + width / 2, margin.top + height / 2])

    d3.json("https://d3js.org/us-10m.v1.json", function (error, us) {
        if (error) throw error;

        svg.append("g")
            .attr("class", "states")
            .attr("fill-opacity", 0.4)
            .selectAll("path")
            .data(topojson.feature(us, us.objects.states).features)
            .enter().append("path")
            .attr("d", path);

        svg.append("path")
            .attr("class", "state-borders")
            .attr("d", path(topojson.mesh(us, us.objects.states, function (a, b) { return a !== b; })));
    });


    svg.selectAll("myCircles")
        .data(data)
        .enter()
        .append("circle")
        .attr("cx", function (d) { return projection([d.lon, d.lat])[0]; })
        .attr("cy", function (d) { return projection([d.lon, d.lat])[1]; })
        .attr("r", 14)  //first testing with fixed radius and then will scale acccording to count
        .style("fill", "69b3a2")
        .attr("stroke", "#69b3a2")
        .attr("stroke-width", 3)
        .attr("fill-opacity", 1);

}
我不知道这些泡沫是否真的在下降--我肯定是在寻找这个地方。
回答 1
Stack Overflow用户
发布于 2019-09-20 23:17:44
至于一种测试方法,以确定特征是否正确,尝试放置容易识别地标,我使用Seatle和迈阿密下面--它们位于感兴趣区域的对立面,而且应该很容易判断它们是在错误的地方(在水还是内陆)。
我不知道它们应该落在哪里,因为我没有坐标,但我可以告诉你,它们不在它们应该在的位置。
我之所以知道这是因为你对你的数据使用了两个不同的投影。
墨卡托投影
您可以定义其中一个投影并使用它来定位点:
var projection = d3.geoMercator()
    .scale(200)
.translate([margin.left + width / 2, margin.top + height / 2])这是以0°,0°为中心的墨卡托投影。下面是用该预测(边距和相同大小的SVG)预测的世界:
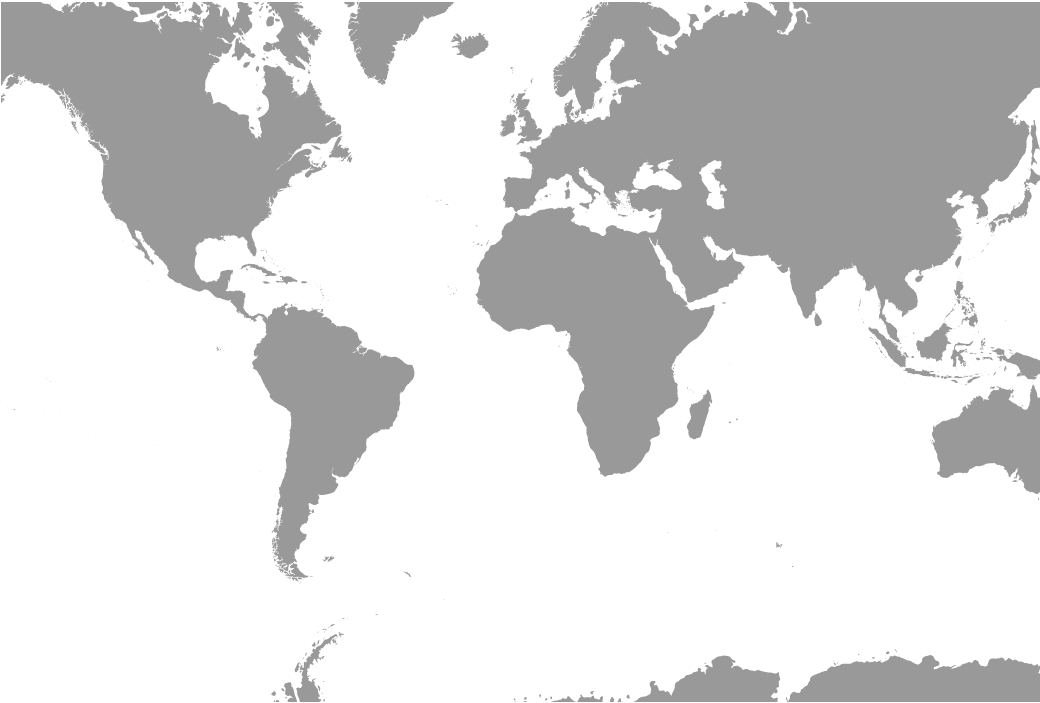
D3 GᴇᴏMᴇʀᴄᴀᴛᴏʀWɪᴛʜCᴇɴᴛᴇʀ0,0ᴀɴᴅSᴄᴀʟᴇ200
你正在根据这个投影投影圆的坐标。
为了提高可复制性,下面是一个片段--您应该在全屏上查看:
  var margin = { top: 20, right: 20, bottom: 30, left: 50 },
  width = 1040 - margin.left - margin.right,
  height = 700 - margin.top - margin.bottom;

d3.json("https://cdn.jsdelivr.net/npm/world-atlas@2/land-50m.json").then(function(json) {

  var svg = d3.select("body")
    .append("svg")
    .attr("width", width + margin.left + margin.right)
    .attr("height", height + margin.top + margin.bottom)

  var projection = d3.geoMercator()
    .scale(200)
    .translate([margin.left + width / 2, margin.top + height / 2])

  var path = d3.geoPath().projection(projection);

  svg.append("g")
     .attr("class", "states")
     .attr("fill-opacity", 0.4)
     .selectAll("path")
     .data(topojson.feature(json, json.objects.land).features)
     .enter().append("path")
     .attr("d", path);
})<script src="https://cdnjs.cloudflare.com/ajax/libs/d3/5.7.0/d3.min.js"></script>
<script src="https://cdnjs.cloudflare.com/ajax/libs/topojson/3.0.2/topojson.js"></script>
神秘投影
第二个投影不明显。如果您查看用于创建上述图像的代码段,您会注意到它将投影分配给路径:
var path = d3.geoPath().projection(projection);因此,路径将每个地理坐标(球面纬度/经度对)转换为屏幕上的正确坐标(笛卡尔像素x,y值):-17°、85°的坐标将转换为100 be、50 be。
在您的问题中,您只需使用:
var path = d3.geoPath();您不会为路径分配投影-因此d3.geoPath()只是绘制geojson/topojson中的每个顶点/点,就好像该坐标包含像素坐标一样:在x=100,y=50的SVG上绘制一个100 of的坐标,50 of的geojson/topojson。
尽管没有使用投影,但你们的美国各州仍如预期的那样策划。为什么?因为geojson/topojson已经被预测了。因为它是预先投影的,所以当我们用D3绘制它时,我们不需要使用投影。
预投影几何可能是有用的,因为它需要更少的计算来绘制,导致更快的渲染速度,但成本较低的灵活性(见这里)。
如果我们将预投影的几何图形与d3投影的几何图形叠加起来,我们会得到:
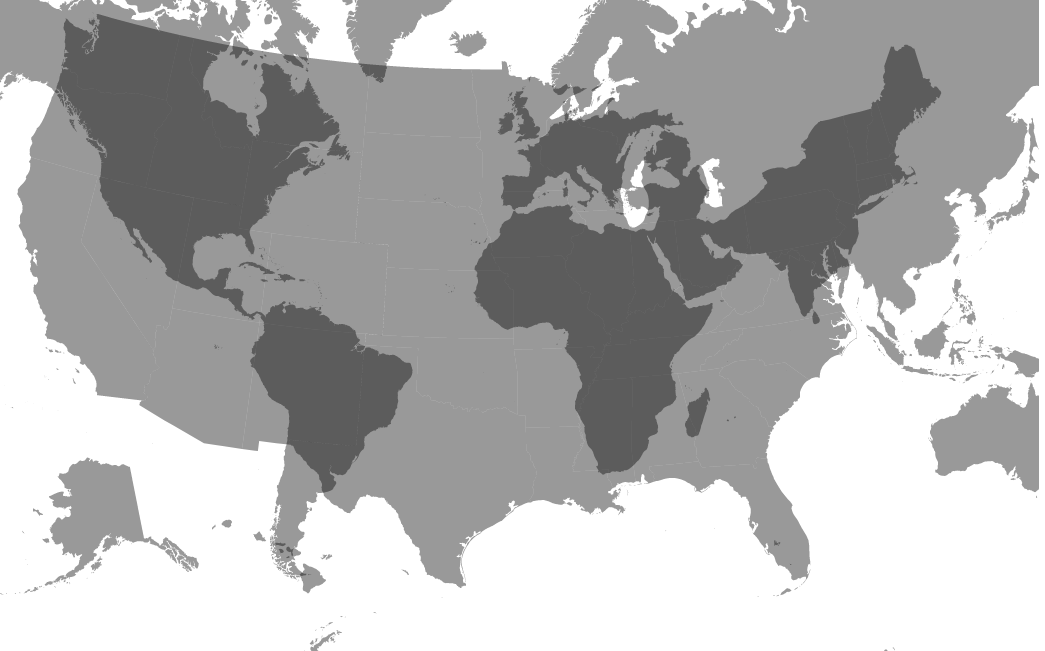
当然,你可以看到,两者之间没有相同的意义。因此,你不是突出点,以使他们正确地覆盖预先投影的几何.
Cᴏᴍᴘᴀʀɪsᴏɴʙᴇᴛᴡᴇᴇɴᴛʜᴇᴛᴡᴏᴘʀᴏᴊᴇᴄᴛɪᴏɴs
用于复制的片段:
var margin = { top: 20, right: 20, bottom: 30, left: 50 },
        width = 1040 - margin.left - margin.right,
        height = 700 - margin.top - margin.bottom;

   var svg = d3.select("body")
		  .append("svg")
          .attr("width", width + margin.left + margin.right)
          .attr("height", height + margin.top + margin.bottom)

	d3.json("https://cdn.jsdelivr.net/npm/world-atlas@2/land-50m.json").then(function(json) {

        var projection = d3.geoMercator()
          .scale(200)
          .translate([margin.left + width / 2, margin.top + height / 2])

		var path = d3.geoPath().projection(projection);

		svg.append("g")
            .attr("fill-opacity", 0.4)
            .selectAll("path")
            .data(topojson.feature(json, json.objects.land).features)
            .enter().append("path")
            .attr("d", path);

	})

	d3.json("https://d3js.org/us-10m.v1.json").then(function(us) {

		var path = d3.geoPath();

        svg.append("g")
            .attr("fill-opacity", 0.4)
            .selectAll("path")
            .data(topojson.feature(us, us.objects.states).features)
            .enter().append("path")
            .attr("d", path);

})<script src="https://cdnjs.cloudflare.com/ajax/libs/d3/5.7.0/d3.min.js"></script>
<script src="https://cdnjs.cloudflare.com/ajax/libs/topojson/3.0.2/topojson.js"></script>
不满意的解决办法
如果没有元数据解释geojson/topojson所使用的投影和坐标系统,我们通常无法复制该投影以覆盖其他特性。
然而,在这种情况下,如果我们仔细观察被绘制的美国各州,我们可以看到,阿尔贝尔斯投影是用来预先规划州轮廓的。
有时,我们可以猜到投影参数。由于我对这个文件()相当熟悉,我可以告诉您它使用以下参数:
d3.geoAlbersUsa()
  .scale(d3.geoAlbersUsa().scale()*6/5)
  .translate([480,300]);
下面是一个显示迈阿密和西雅图重叠的例子:
  var width = 960,height = 600;

var svg = d3.select("body")
	.append("svg")
  .attr("width",width)
  .attr("height",height);

d3.json("https://d3js.org/us-10m.v1.json").then(function(us) {

  var path = d3.geoPath();
  var projection = d3.geoAlbersUsa()
    .scale(d3.geoAlbersUsa().scale()*6/5)
    .translate([width/2,height/2]);

  svg.append("g")
    .attr("fill-opacity", 0.4)
    .selectAll("path")
    .data(topojson.feature(us, us.objects.states).features)
    .enter().append("path")
    .attr("d", path);

    var places = [
      [-122.3367534,47.5996582],
      [-80.1942949,25.7645783]
    ]

    svg.selectAll(null)
      .data(places)
      .enter()
      .append("circle")
      .attr("r", 3)
      .attr("transform", function(d) {
        return "translate("+projection(d)+")";
      })

})<script src="https://cdnjs.cloudflare.com/ajax/libs/d3/5.7.0/d3.min.js"></script>
<script src="https://cdnjs.cloudflare.com/ajax/libs/topojson/3.0.2/topojson.js"></script>
但是,这有一个缺点,就是在其他屏幕尺寸、翻译、中心、缩放等方面采用非常迟钝。预投影几何与非投影几何学相结合也会产生很多混乱。例如,这个问题显示了一种常见的挫折感,即适当调整预投影几何的大小和对其进行中心化.
更好的解决方案
一个更好的解决方案是对每件事使用一个投影。要么先做项目前的一切(这有点复杂),要么动态地投射所有东西(浏览器真的不需要那么长的时间)。在修改可视化或地理数据时,这一点更清晰、更容易。
要以同样的方式投影所有数据,您需要确保所有数据都是非投影的,也就是说,它使用lat/long对作为其坐标/坐标空间。既然你的美国json是预先预测的,我们需要另找一个,也许:
我们只需通过投影进行所有的操作:
代码段不会加载资源,但是https://bl.ocks.org/Andrew-Reid/2fbfe375788b3661f4c3761f6d7e59c1是一个bl.ock,代码如下所示:
var width =960,height = 600;

var svg = d3.select("body")
    .append("svg")
  .attr("width",width)
  .attr("height",height);

d3.json("us.json").then(function(us) {

  var projection = d3.geoAlbersUsa()
    .scale(150)
    .translate([width/2,height/2]);
   var path = d3.geoPath().projection(projection);

  svg.append("g")
    .attr("fill-opacity", 0.4)
    .selectAll("path")
    .data(topojson.feature(us, us.objects.states).features)
    .enter().append("path")
    .attr("d", path);

    var places = [
      [-122.3367534,47.5996582],
      [-80.1942949,25.7645783]
    ]

    svg.selectAll(null)
      .data(places)
      .enter()
      .append("circle")
      .attr("r", 3)
      .attr("transform", function(d) {
        return "translate("+projection(d)+")";
      })

})https://stackoverflow.com/questions/58035696
复制相似问题
腾讯云开发者

Copyright © 2013 - 2026 Tencent Cloud. All Rights Reserved. 腾讯云 版权所有
深圳市腾讯计算机系统有限公司 ICP备案/许可证号:粤B2-20090059 ![]() 粤公网安备44030502008569号
粤公网安备44030502008569号
腾讯云计算(北京)有限责任公司 京ICP证150476号 | 京ICP备11018762号