
将数值间隔限制设置为Matplotlib中绘图函数的输入
将数值间隔限制设置为Matplotlib中绘图函数的输入
提问于 2019-09-25 15:09:46
我正在绘制这个数字,但我想利用这段时间。但是,我不想每次手动修改legend、DataFrame列名和其他变量。理想情况下,我会发送范围"<", "<=", ">="作为输入参数。这在Python中是可能的吗?
守则:
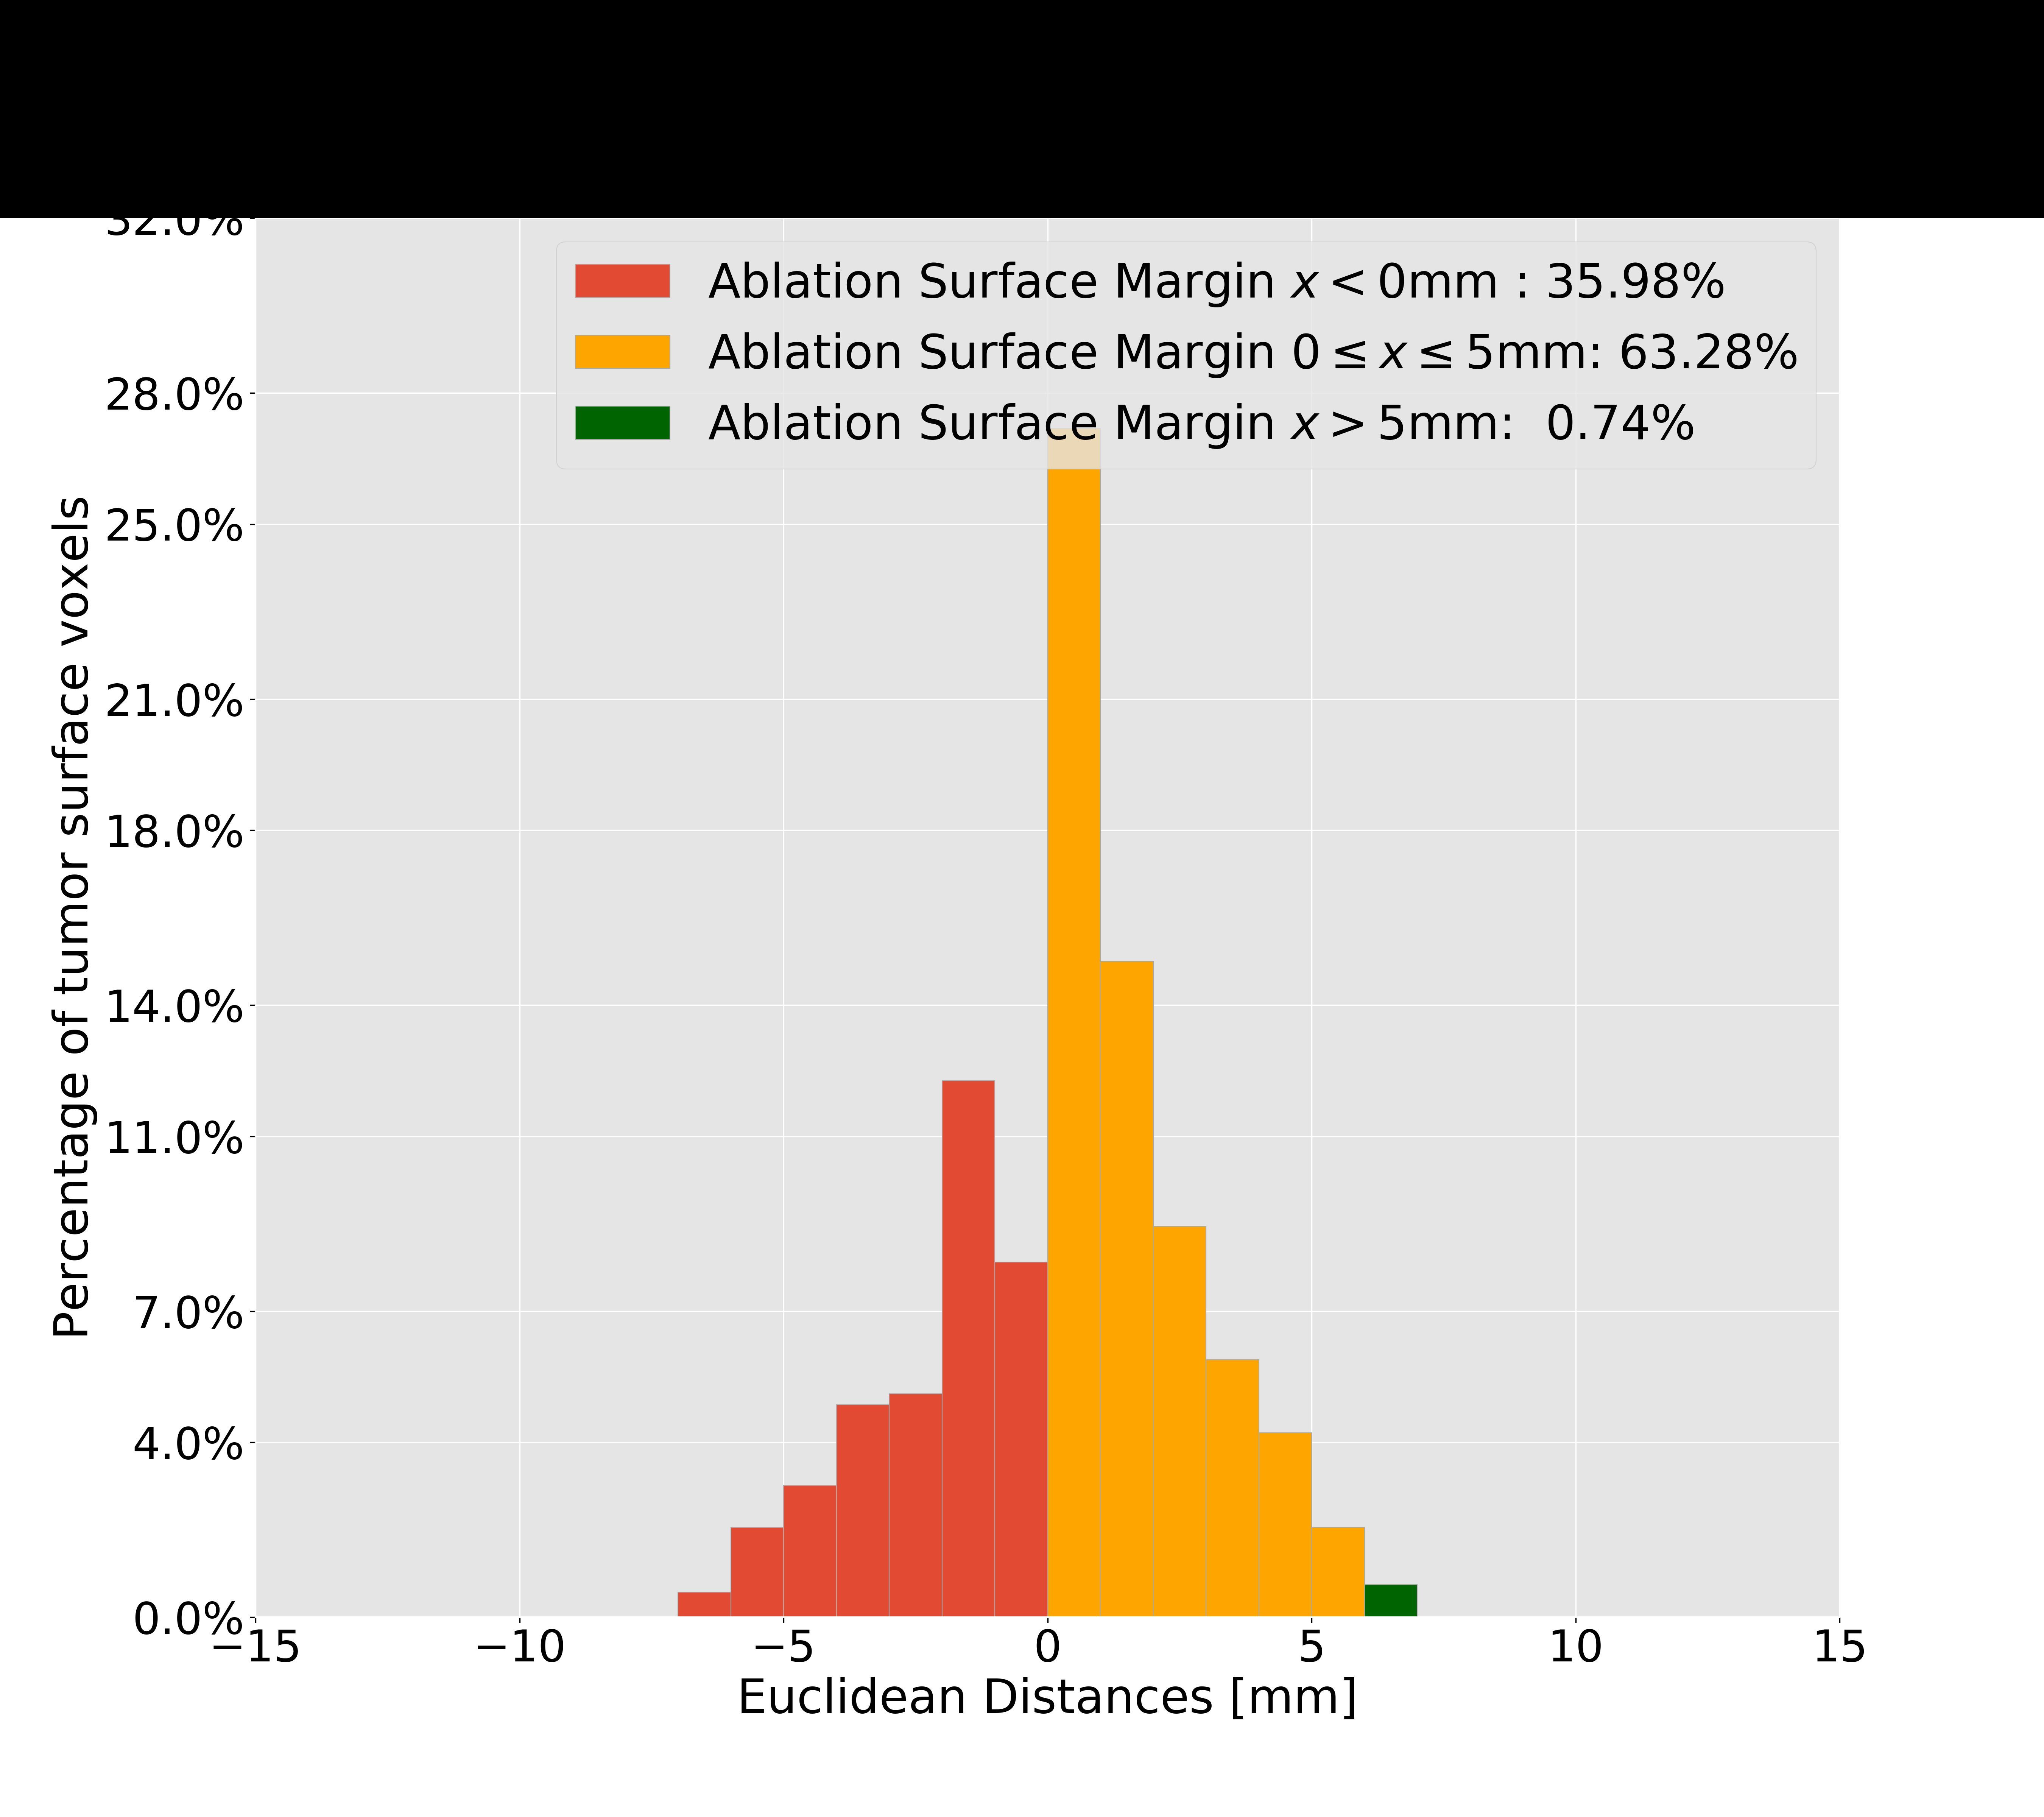
def plotHistDistances(pat_name, lesion_id, rootdir, distanceMap, num_voxels, title, ablation_date):
    # PLOT THE HISTOGRAM FOR THE MAUERER EUCLIDIAN DISTANCES
    lesion_id_str = str(lesion_id)
    lesion_id = lesion_id_str.split('.')[0]
    figName_hist = 'Pat_' + str(pat_name) + '_Lesion' + str(lesion_id) + '_AblationDate_' + ablation_date + '_histogram'
    min_val = int(np.floor(min(distanceMap)))
    max_val = int(np.ceil(max(distanceMap)))
    fig, ax = plt.subplots(figsize=(18, 16))

    col_height, bins, patches = ax.hist(distanceMap, ec='darkgrey', bins=range(min_val - 1, max_val + 1))

    voxels_nonablated = []
    voxels_insuffablated = []
    voxels_ablated = []

    for b, p, col_val in zip(bins, patches, col_height):
        if b < 0:
            voxels_nonablated.append(col_val)
        elif 0 <= b <= 5:
            voxels_insuffablated.append(col_val)
        elif b > 5:
            voxels_ablated.append(col_val)
    # %%
    '''calculate the total percentage of surface for ablated, non-ablated, insufficiently ablated'''

    voxels_nonablated = np.asarray(voxels_nonablated)
    voxels_insuffablated = np.asarray(voxels_insuffablated)
    voxels_ablated = np.asarray(voxels_ablated)

    sum_perc_nonablated = ((voxels_nonablated / num_voxels) * 100).sum()
    sum_perc_insuffablated = ((voxels_insuffablated / num_voxels) * 100).sum()
    sum_perc_ablated = ((voxels_ablated / num_voxels) * 100).sum()
    # %%
    '''iterate through the bins to change the colors of the patches bases on the range [mm]'''
    for b, p, col_val in zip(bins, patches, col_height):
        if b < 0:
            plt.setp(p, label='Ablation Surface Margin ' + r'$x < 0$' + 'mm :' + " %.2f" % sum_perc_nonablated + '%')
        elif 0 <= b <= 5:
            plt.setp(p, 'facecolor', 'orange',
                     label='Ablation Surface Margin ' + r'$0 \leq  x \leq 5$' + 'mm: ' + "%.2f" % sum_perc_insuffablated + '%')
        elif b > 5:
            plt.setp(p, 'facecolor', 'darkgreen',
                     label='Ablation Surface Margin ' + r'$x > 5$' + 'mm: ' + " %.2f" % sum_perc_ablated + '%')
    # %%
    '''edit the axes limits and labels'''
    plt.xlabel('Euclidean Distances [mm]', fontsize=30, color='black')
    plt.tick_params(labelsize=28, color='black')
    ax.tick_params(colors='black', labelsize=28)
    plt.grid(True)
    # TODO: set equal axis limits
    ax.set_xlim([-15, 15])

    # edit the y-ticks: change to percentage of surface
    yticks, locs = plt.yticks()
    percent = (yticks / num_voxels) * 100
    percentage_surface_rounded = np.round(percent)
    yticks_percent = [str(x) + '%' for x in percentage_surface_rounded]
    new_yticks = (percentage_surface_rounded * yticks) / percent
    new_yticks[0] = 0
    plt.yticks(new_yticks, yticks_percent)
    #    plt.yticks(yticks,yticks_percent)
    plt.ylabel('Percentage of tumor surface voxels', fontsize=30, color='black')

    handles, labels = plt.gca().get_legend_handles_labels()
    by_label = OrderedDict(zip(labels, handles))
    plt.legend(by_label.values(), by_label.keys(), fontsize=30, loc='best')

    plt.title(title + '. Patient ' + str(pat_name) + '. Lesion ' + str(lesion_id), fontsize=30)
数字:
因此,我想将您在legend中看到的间隔作为输入发送到这里:
def plotHistDistances(pat_name, lesion_id, rootdir, distanceMap,
num_voxels, title, ablation_date, interval_limits):回答 1
Stack Overflow用户
回答已采纳
发布于 2019-09-25 15:35:56
其思想是将range元素(即示例代码中的0和5)参数化为interval_limits。为此,我假设参数interval_limits将是以下形式的两个值的列表:[min_value, max_value]或具体给定您的示例,interval_limits应该是0,5的列表,如下所示:
interval_limits = [0, 5]基于这个假设,我对你的代码做了一点修改。请注意新块,其中我将interval_limits的第一个元素分配给一个新变量min_limit,将interval_limits的第二个元素分配给另一个新变量max_limit,然后我使用'%.2f格式修改了标签字符串(您可以随意转换到任何格式)。
下面是代码:
def plotHistDistances(pat_name, lesion_id, rootdir, distanceMap, num_voxels, title, ablation_date, interval_limits):
    ##########################################
    # NEW COODE SECTION
    ##########################################
    # Check if interval_limits contains all the limits
    if len(interval_limits) != 2:
        raise ValueError("2 limits are expected, got {} instead.".format(len(interval_limits)))
    # Assign the limits
    min_limit = interval_limits[0]
    max_limit = interval_limits[1]
    ##########################################
    # END OF NEW CODE SECTION
    ##########################################

    # PLOT THE HISTOGRAM FOR THE MAUERER EUCLIDIAN DISTANCES
    lesion_id_str = str(lesion_id)
    lesion_id = lesion_id_str.split('.')[0]
    figName_hist = 'Pat_' + str(pat_name) + '_Lesion' + str(lesion_id) + '_AblationDate_' + ablation_date + '_histogram'
    min_val = int(np.floor(min(distanceMap)))
    max_val = int(np.ceil(max(distanceMap)))
    fig, ax = plt.subplots(figsize=(18, 16))

    col_height, bins, patches = ax.hist(distanceMap, ec='darkgrey', bins=range(min_val - 1, max_val + 1))

    voxels_nonablated = []
    voxels_insuffablated = []
    voxels_ablated = []

    for b, p, col_val in zip(bins, patches, col_height):
        if b < min_limit:
            voxels_nonablated.append(col_val)
        elif min_limit <= b <= max_limit:
            voxels_insuffablated.append(col_val)
        elif b > max_limit:
            voxels_ablated.append(col_val)
    # %%
    '''calculate the total percentage of surface for ablated, non-ablated, insufficiently ablated'''

    voxels_nonablated = np.asarray(voxels_nonablated)
    voxels_insuffablated = np.asarray(voxels_insuffablated)
    voxels_ablated = np.asarray(voxels_ablated)

    sum_perc_nonablated = ((voxels_nonablated / num_voxels) * 100).sum()
    sum_perc_insuffablated = ((voxels_insuffablated / num_voxels) * 100).sum()
    sum_perc_ablated = ((voxels_ablated / num_voxels) * 100).sum()
    # %%
    '''iterate through the bins to change the colors of the patches bases on the range [mm]'''
    for b, p, col_val in zip(bins, patches, col_height):
        if b < min_limit:
            plt.setp(p, label='Ablation Surface Margin ' + r'$x < %.2f$' % min_limit + 'mm :' + " %.2f" % sum_perc_nonablated + '%')
        elif min_limit <= b <= max_limit:
            plt.setp(p, 'facecolor', 'orange',
                     label='Ablation Surface Margin ' + r'$%.2f \leq  x \leq %.2f$' % (min_limit, max_limit) + 'mm: ' + "%.2f" % sum_perc_insuffablated + '%')
        elif b > max_limit:
            plt.setp(p, 'facecolor', 'darkgreen',
                     label='Ablation Surface Margin ' + r'$x > %.2f$' % max_limit + 'mm: ' + " %.2f" % sum_perc_ablated + '%')
    # %%
    '''edit the axes limits and labels'''
    plt.xlabel('Euclidean Distances [mm]', fontsize=30, color='black')
    plt.tick_params(labelsize=28, color='black')
    ax.tick_params(colors='black', labelsize=28)
    plt.grid(True)
    # TODO: set equal axis limits
    ax.set_xlim([-15, 15])

    # edit the y-ticks: change to percentage of surface
    yticks, locs = plt.yticks()
    percent = (yticks / num_voxels) * 100
    percentage_surface_rounded = np.round(percent)
    yticks_percent = [str(x) + '%' for x in percentage_surface_rounded]
    new_yticks = (percentage_surface_rounded * yticks) / percent
    new_yticks[0] = 0
    plt.yticks(new_yticks, yticks_percent)
    #    plt.yticks(yticks,yticks_percent)
    plt.ylabel('Percentage of tumor surface voxels', fontsize=30, color='black')

    handles, labels = plt.gca().get_legend_handles_labels()
    by_label = OrderedDict(zip(labels, handles))
    plt.legend(by_label.values(), by_label.keys(), fontsize=30, loc='best')

plt.title(title + '. Patient ' + str(pat_name) + '. Lesion ' + str(lesion_id), fontsize=30)免责声明:我还没有测试这段代码,因为我没有完整的参数来重现结果,但是这应该可以。如果不给我提供您使用的参数集,我将看看如何纠正这个问题。
页面原文内容由Stack Overflow提供。腾讯云小微IT领域专用引擎提供翻译支持
原文链接:
https://stackoverflow.com/questions/58101558
复制相关文章
相似问题
腾讯云开发者

Copyright © 2013 - 2026 Tencent Cloud. All Rights Reserved. 腾讯云 版权所有
深圳市腾讯计算机系统有限公司 ICP备案/许可证号:粤B2-20090059 ![]() 粤公网安备44030502008569号
粤公网安备44030502008569号
腾讯云计算(北京)有限责任公司 京ICP证150476号 | 京ICP备11018762号