
强制facet_grid以与它们在数据集中出现的顺序相同的顺序绘制面
强制facet_grid以与它们在数据集中出现的顺序相同的顺序绘制面
提问于 2019-09-30 20:18:19
我正致力于单一个案研究的视觉表现。我需要对ggplot2中的图形做一些修改,但我发现这有点困难。以下是我用来制作一个可复制示例的玩具数据集中包含的变量的简要描述:
- 场合:评估行为的次数(从1到n);
- 时间:每种情况的次数(基线从1到n,干预从1到n);
- 阶段:条件(A =基线或B=干预);
- ID:学习中的学生代码<>编码>H19结果:行为检查表上的总分。< code >H 210
F 211
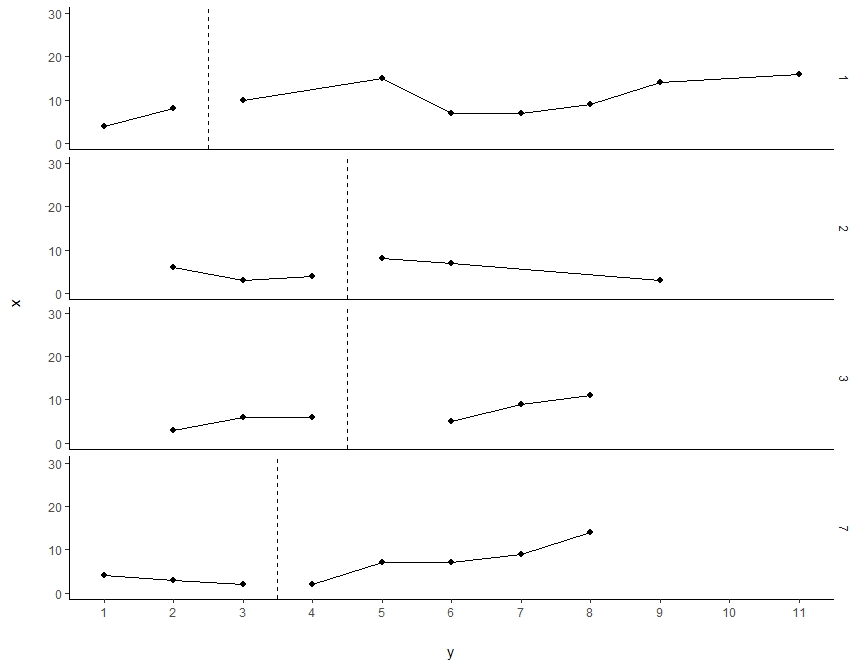
根据数据集中的标准(即第一次干预会话)对案件进行排序。不幸的是,当我用ggplot2::facet_grid创建不同的方面时,案例按照它们的数量进行排序,我得到了您可以在下面的图像中看到的内容。我试图改变变量类型(从整数到因子,从因子到字符,等等),但是似乎没有什么变化。最后,我不能手动排序这些方面,因为实际的数据集包含更多的情况。
outcome <- c(4, 8, 10, NA, 15, 7, 7, 9, 14, NA, 16, 4, 3, 2, 2, 7, 7, 9, 14, NA, 3, 6, 6, NA, 5, 9, 11, NA, 6, 3, 4, 8, 7, NA, NA, 3)
Phase <- c("A", "A", "B", "B", "B", "B", "B", "B", "B", "B", "B", "A", "A", "A", "B", "B", "B", "B", "B", "A", "A", "A", "A", "B", "B", "B", "B", "A", "A", "A", "A", "B", "B", "B", "B", "B")
Time <- c(1, 2, 3, 4, 5, 1, 2, 3, 4, 5, 6, 1, 2, 3, 4, 1, 2, 3, 4, 1, 2, 3, 4, 1, 2, 3, 4, 1, 2, 3, 4, 1, 2, 3, 4, 5)
Occasion <- c(1, 2, 3, 4, 5, 6, 7, 8, 9, 10, 11, 1, 2, 3, 4, 5, 6, 7, 8, 1, 2, 3, 4, 5, 6, 7, 8, 1, 2, 3, 4, 5, 6, 7, 8, 9)
ID <- c(1, 1, 1, 1, 1, 1, 1, 1, 1, 1, 1, 7, 7, 7, 7, 7, 7, 7, 7, 3, 3, 3, 3, 3, 3, 3, 3, 2, 2, 2, 2, 2, 2, 2, 2, 2)


db <- data.frame(ID, Occasion, Time, Phase, outcome)

intervention_lines <- db %>%
  filter(Phase == "A") %>%
  group_by(ID, Phase) %>%
  summarise(y = max(Occasion))

db %>% na.omit(outcome) %>%
  ggplot(aes(x = Occasion, y = outcome, group = Phase)) +
  geom_point(size = 1.8) +
  geom_line(size = 0.65) +
  facet_grid(ID ~ .) +
  scale_x_continuous(name = "y", breaks = seq(0, 11, 1)) +
  scale_y_continuous(name = "x", limits = c(0, 30)) +
  theme_classic() +
  theme(strip.background = element_blank()) +
  annotate("segment", x = -Inf, xend = Inf, y = -Inf, yend = -Inf) +
  geom_vline(data = intervention_lines, aes(xintercept = y + 0.5), colour = "black", linetype = "dashed")
回答 1
Stack Overflow用户
回答已采纳
发布于 2019-09-30 20:41:31
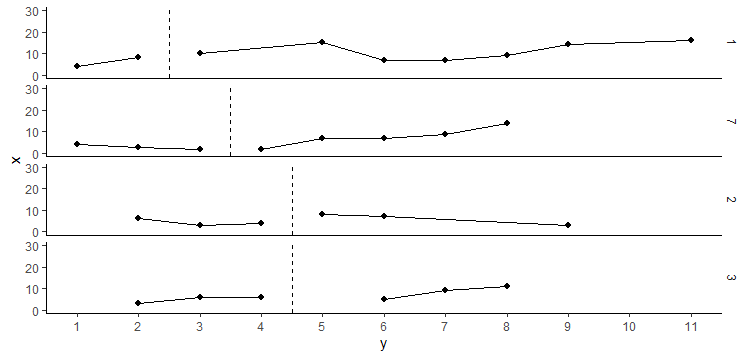
我遇到了一些麻烦,因为您的绘图是为不同的层使用两个数据帧,它们需要匹配的因素才能使面排序工作。
为此,我将ID转换为一个因子,然后在两个地方通过intervention_lines$y对其进行排序。
library(forcats)
intervention_lines <- db %>%
  filter(Phase == "A") %>%
  group_by(ID, Phase) %>%
  summarise(y = max(Occasion)) %>%
  ungroup() %>%
  mutate(ID = ID %>% as_factor() %>% fct_reorder(y))

db %>% na.omit(outcome) %>%
  mutate(ID = as_factor(ID)) %>%
  left_join(intervention_lines %>% select(ID, y)) %>%
  mutate(ID = ID %>% fct_reorder(y)) %>%
  ggplot(aes(x = Occasion, y = outcome, group = Phase)) +
  geom_point(size = 1.8) +
  geom_line(size = 0.65) +
  scale_x_continuous(name = "y", breaks = seq(0, 11, 1)) +
  scale_y_continuous(name = "x", limits = c(0, 30)) +
  theme_classic() +
  theme(strip.background = element_blank()) +
  annotate("segment", x = -Inf, xend = Inf, y = -Inf, yend = -Inf) +
  geom_vline(data = intervention_lines, aes(xintercept = y + 0.5), colour = "black", linetype = "dashed") +
  facet_grid(ID~.)
页面原文内容由Stack Overflow提供。腾讯云小微IT领域专用引擎提供翻译支持
原文链接:
https://stackoverflow.com/questions/58174787
复制相关文章
相似问题
腾讯云开发者

Copyright © 2013 - 2026 Tencent Cloud. All Rights Reserved. 腾讯云 版权所有
深圳市腾讯计算机系统有限公司 ICP备案/许可证号:粤B2-20090059 ![]() 粤公网安备44030502008569号
粤公网安备44030502008569号
腾讯云计算(北京)有限责任公司 京ICP证150476号 | 京ICP备11018762号