
如何编码用户可配置的会话指示符,以绘制线(即时间/范围限制)
如何编码用户可配置的会话指示符,以绘制线(即时间/范围限制)
提问于 2019-10-11 04:56:52
我从一个关于如何以编程方式绘制一个基于时间/范围的框/矩形来设置交易会话的问题开始,但是我意识到松树无法这样做……
然而,我理解松树v4引入了绘制行对象的能力,并想知道是否有人能为代码绘制会话行指出正确的方向。我的意思是,对于指定的开始/结束时间(即时间段的最高和最低值),你会非常感激吗?
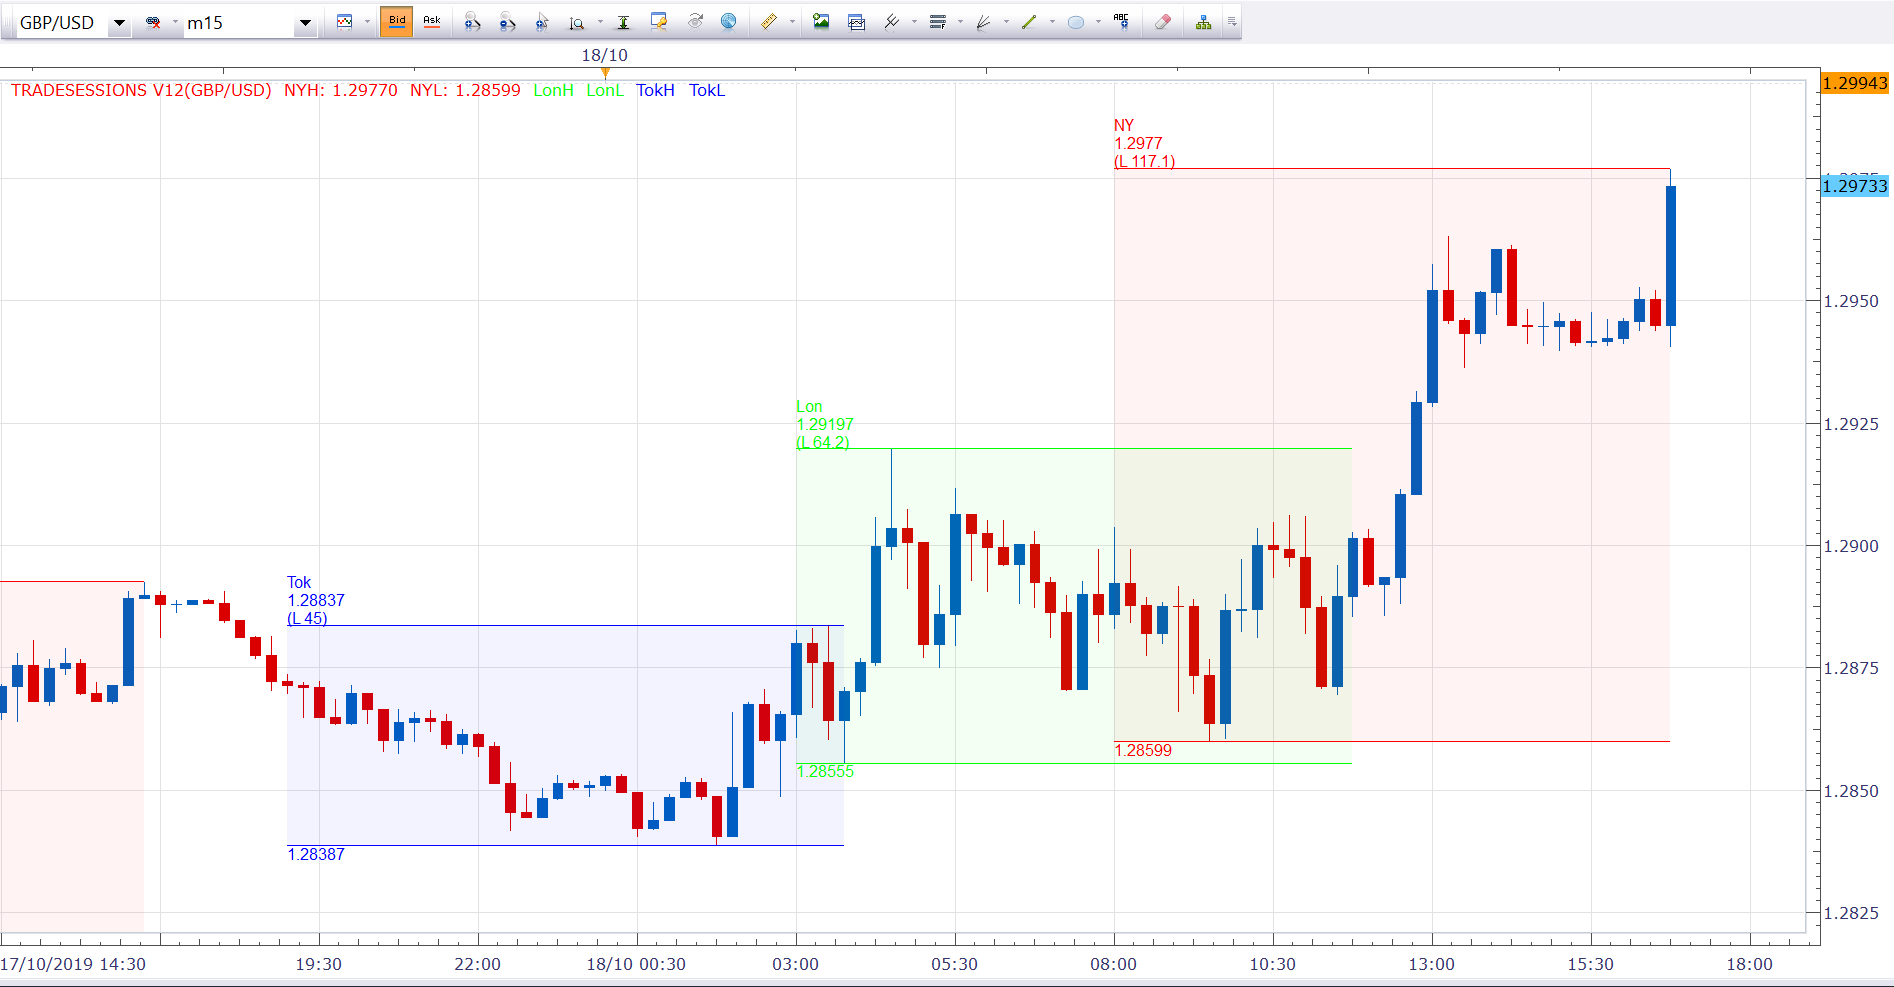
我正在寻找的能力,绘制一个线/框,根据从FXCM Tradestation会话指示器,其中包括会话名称,价格水平和范围的附加图像。请注意,最高/最低价格水平显示在整个期间,而不是逐步‘增长’随着价格的发展与每条。
RVK:
回答 1
Stack Overflow用户
发布于 2019-10-18 06:54:55
不知道你到底在找什么,所以不能确定这在松树里是不可能的。
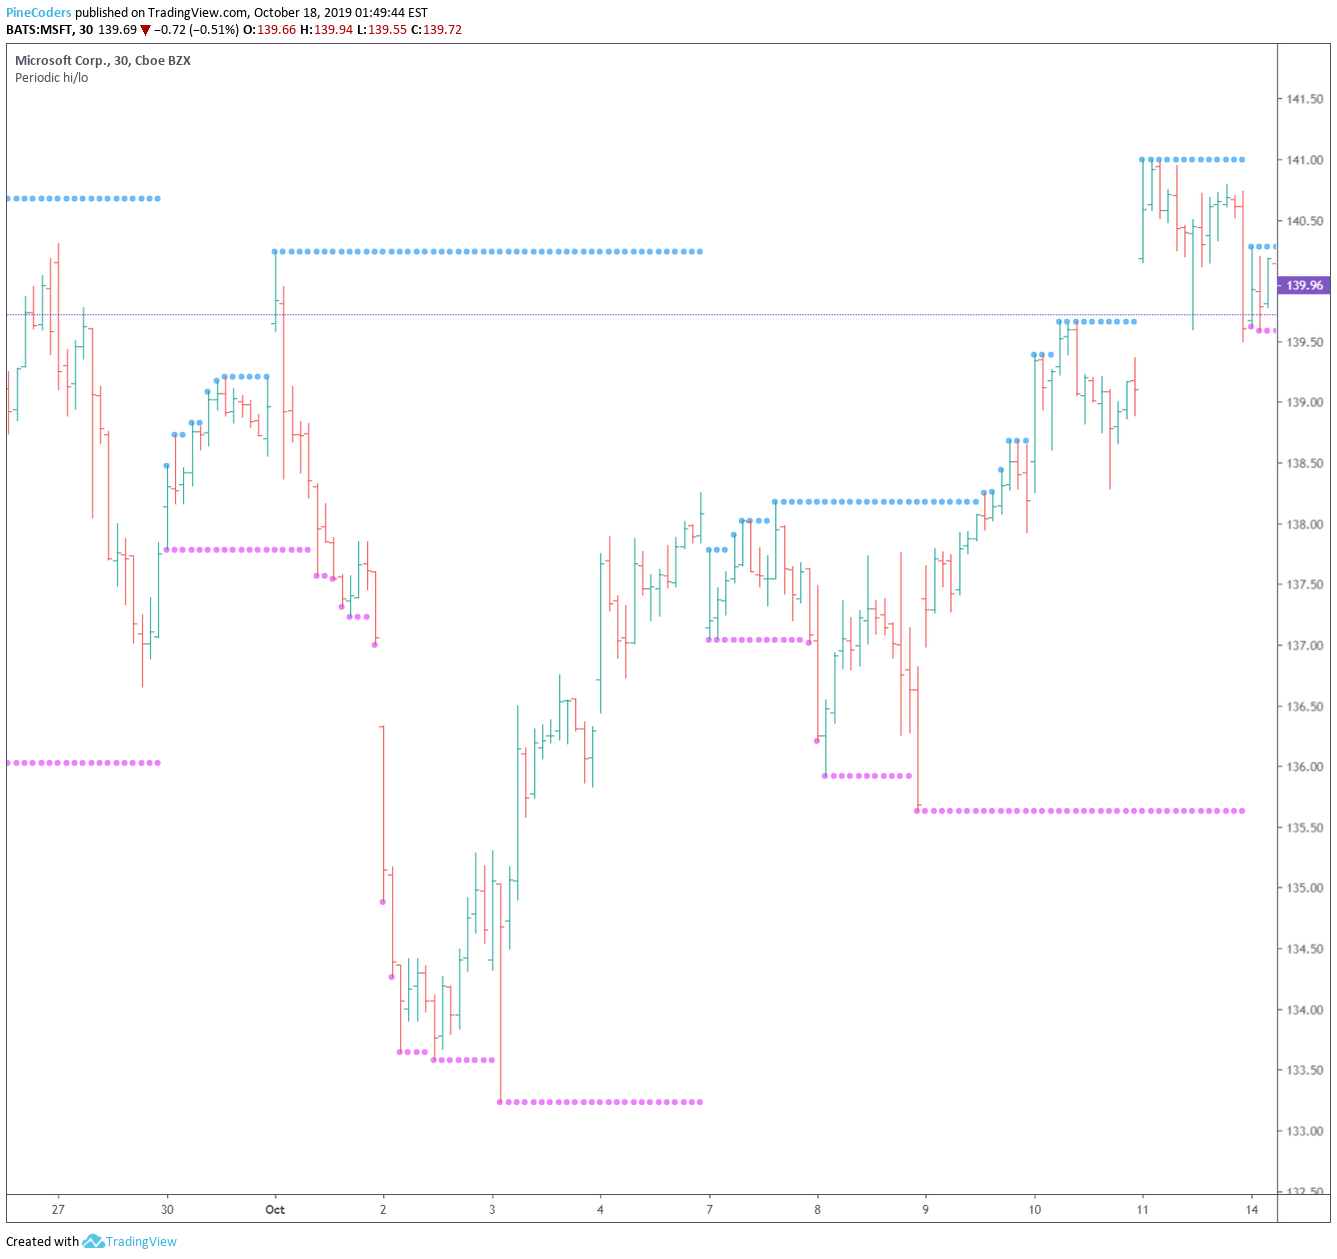
随着本周的展开,这里记录了每周的嗨/洛:
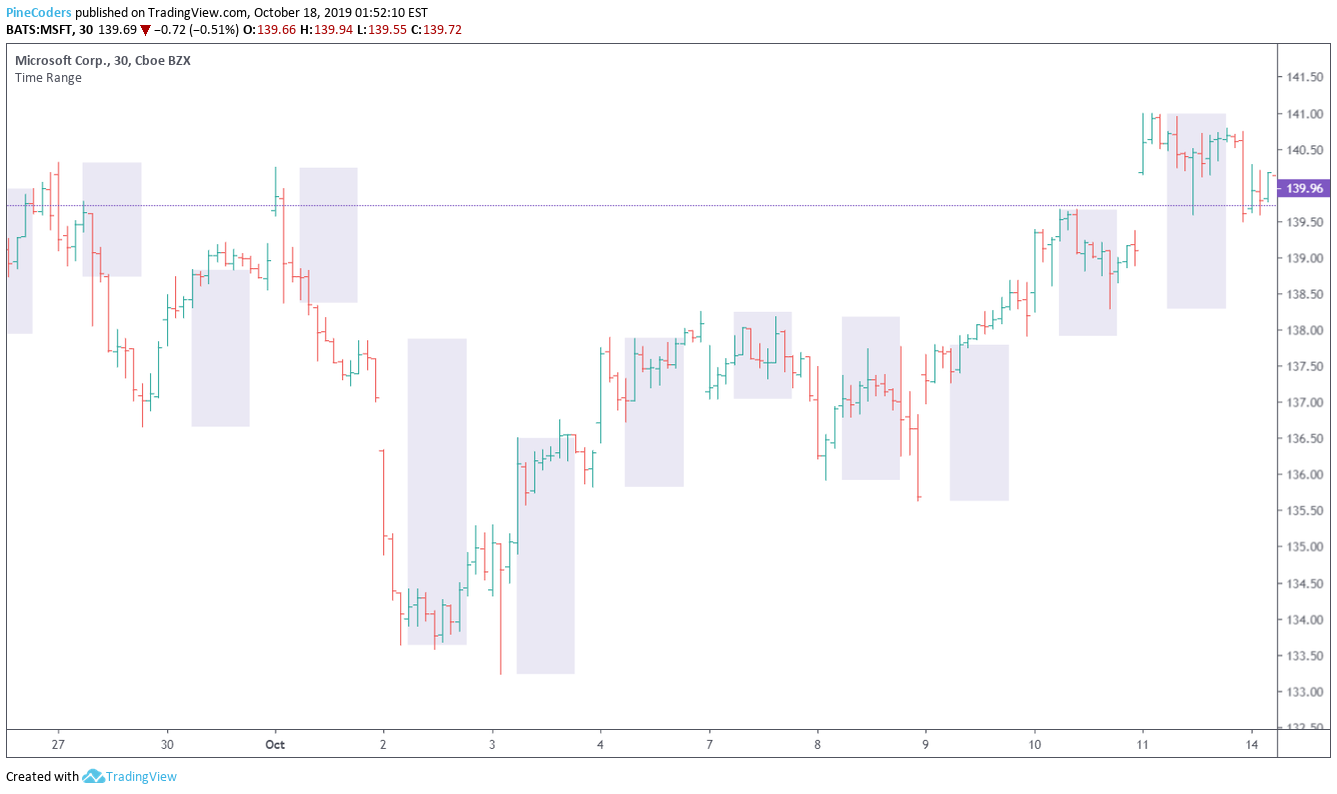
此代码是使用可配置会话范围的变体,有几种不同的突出显示会话的方法:
//@version=4
//@author=LucF, for PineCoders
study("Time Range", "", true)
sessionInfo = input("1100-1500", "Session")
boxType = input("Fixed levels", "Box Type", options = ["None", "Dynamic levels", "Fixed levels"])
showBg = input(false, "Show background")
squareBox = boxType == "Fixed levels"
dynamicBox = boxType == "Dynamic levels"
showBox = squareBox or dynamicBox

inSession = time(timeframe.period, sessionInfo)
invisible = #FFFFFF

loLevel = lowest(10)
hiLevel = highest(10)
var hi = 10e-10
var lo = 10e10
// When a new period begins, reset hi/lo.
if inSession and not inSession[1]
    hi := dynamicBox ? high : hiLevel
else
    if dynamicBox
        hi := max(high, hi)
if inSession and not inSession[1]
    lo := dynamicBox ? low : loLevel
else
    if dynamicBox
        lo := min(low, lo)

hiPlot = plot(showBox and inSession ? hi : na, "Highs", invisible)
loPlot = plot(showBox and inSession ? lo : na, "Lows", invisible)
fill(hiPlot, loPlot, color.navy)

// Plot background.
bgcolor(showBg and inSession ? color.blue : na)
这里用3种不同的方法之一突出显示"1100-1500“会话:
页面原文内容由Stack Overflow提供。腾讯云小微IT领域专用引擎提供翻译支持
原文链接:
https://stackoverflow.com/questions/58334458
复制相关文章
相似问题
腾讯云开发者

Copyright © 2013 - 2026 Tencent Cloud. All Rights Reserved. 腾讯云 版权所有
深圳市腾讯计算机系统有限公司 ICP备案/许可证号:粤B2-20090059 ![]() 粤公网安备44030502008569号
粤公网安备44030502008569号
腾讯云计算(北京)有限责任公司 京ICP证150476号 | 京ICP备11018762号