
将文件图和函数图结合在一起的图和and图
将文件图和函数图结合在一起的图和and图
提问于 2019-10-28 15:10:27
我想在一个图中的函数图上画一条直线的路径。我的代码:
reset
#set output 'potential_tr_pfad3.tex'
set terminal tikz color size 18cm, 8cm
unset key

set view map
set samples 80, 80
set isosamples 80, 80

plot 'tr_path.dat' with circles lc rgb "#90EE90" fs transparent solid 0.15 border,\
'tr_path.dat' u 1:2 with linespoints lw 2 lc rgb "#000000"

set xr [x=-4:4]
set yr [y=-11:2]

potential(x,y) = 5*(x**2+y**2+8*x+6*y)**2+5*(x**2+y**2-6*x+8*y)**2+1000*y

set contour base
set cntrparam bspline
set cntrparam levels discrete 20000,10000,2500,0,-2500,-5000, -6000,-7000
do for [t=1:8] {
set linetype t lc rgb "#888888"
}

set xlabel "X"
set ylabel "Y"
set zlabel '{/Symbol P}' enhanced
set zlabel  offset character 7, 9, 0

potential(x,y) = 5*(x**2+y**2+8*x+6*y)**2+5*(x**2+y**2-6*x+8*y)**2+1000*y
set xr [x=-4:4]
set yr [y=-10:1]

set style textbox opaque margins  0.5,  0.5 fc  bgnd noborder linewidth  1.0
set cntrlabel start 0  format "%16.0f" font ",6" interval 100
unset surface

splot potential(x,y) with lines lc rgb "#000000",\
potential(x,y) with labels boxed notitle
使用数据文件:
0.00000000e+000   0.00000000e+000  1.0000000
0.00000000e+000  -1.00000000e+000  2.0000000
-7.21690590e-002 -2.37121212e+000  4.0000000
到目前为止,我的解决方案是将LaTeX中的两幅tikz图片结合起来。但是,必须有一个更好的方法,而不是陷入麻烦的图形边界。有什么想法吗?
事先向大家问好,谢谢!
回答 1
Stack Overflow用户
回答已采纳
发布于 2019-10-29 06:28:07
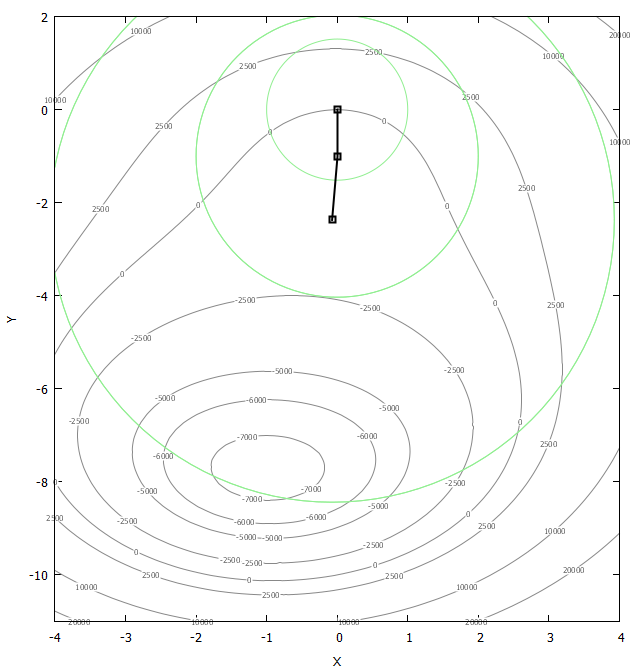
我想,这里的问题是,带等高线的splot和带圆圈的plot不能一起使用。一种解决方案是将等高线数据绘制到一个表中,然后与一个plot命令一起绘制它。我已经重新安排或重写了你的代码。我想这应该接近你想要达到的目标,并可以进一步调整。下面的输出是用gnuket5.2.6和wxt终端创建的。
代码:
### plot contour data together with something else
reset session
unset key

set view map
set samples 80, 80
set isosamples 80, 80

set xr [x=-4:4]
set yr [y=-11:2]

potential(x,y) = 5*(x**2+y**2+8*x+6*y)**2+5*(x**2+y**2-6*x+8*y)**2+1000*y
set contour base
set cntrparam bspline
set cntrparam levels discrete 20000,10000,2500,0,-2500,-5000, -6000,-7000
unset surface

# write contour data to table
set table $Potential
    splot potential(x,y)
unset table

set xlabel "X"
set ylabel "Y"
set zlabel '{/Symbol P}' enhanced
set zlabel  offset character 7, 9, 0

set style textbox opaque margins  0.5,  0.5 fc  bgnd noborder linewidth  1.0

plot $Potential u 1:2 w l lc rgb "#888888",\
     '' every 100 w labels boxed  font ",6" notitle, \
     'MyData.dat' u 1:2:3 w circles lc rgb "#90EE90",\
     '' u 1:2:3 w lp lw 2 lc rgb "#000000"
### end of code
MyData.dat
0.00000000e+000   0.00000000e+000  1.0000000
0.00000000e+000  -1.00000000e+000  2.0000000
-7.21690590e-002 -2.37121212e+000  4.0000000
结果:
页面原文内容由Stack Overflow提供。腾讯云小微IT领域专用引擎提供翻译支持
原文链接:
https://stackoverflow.com/questions/58593494
复制相关文章
相似问题
腾讯云开发者

Copyright © 2013 - 2026 Tencent Cloud. All Rights Reserved. 腾讯云 版权所有
深圳市腾讯计算机系统有限公司 ICP备案/许可证号:粤B2-20090059 ![]() 粤公网安备44030502008569号
粤公网安备44030502008569号
腾讯云计算(北京)有限责任公司 京ICP证150476号 | 京ICP备11018762号