
如何为QLineSeries/ set系列设置自定义点标签格式?
Context:我尝试在QChart上绘制一个QLineSeries,以便打印值随时间的进展。
因此,X轴(横坐标)是QDateTimeAxis,Y轴(纵坐标)是QValueAxis。
问题:我想显示点标签。但是,我找不到如何为日期时间设置所需的格式。
默认情况下,标签只能绘制点的整数值,这正是我想要的纵坐标值。
但是对于横坐标(datetime)值,它会打印自上一个时代(1970-01-01T00:00:00.000)以来经过的毫秒数。
我希望更改日期时间的格式,以匹配"hh:mm:ss“(这是我用来在QDateTimeAxis上显示滴答的格式)。
我知道有一个QXYSeries::setPointlabelsFormat()允许指定格式,但它只接受@xPoint和@yPoint格式标记(如您在文档中所看到的)。
- 在这里,您可以找到问题的图片:
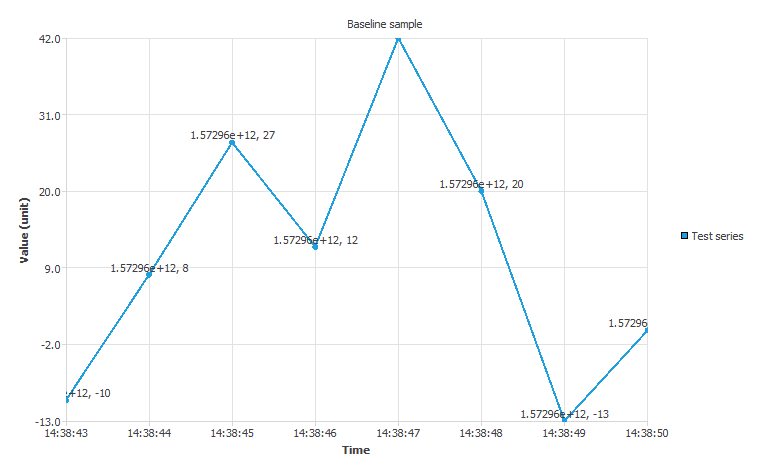
正如您所看到的,我可以为QDateTimeAxis设置格式,但不能在点标签上设置。
生成此输出的代码示例基于提供的这里。我只是添加了更多的点和取消评论行//ls->setPointLabelsVisible(true);。
问题:是否有一种方法可以打印具有自定义格式的@xPoint标签(理想情况下与QDateTime::toString("hh:mm:ss")匹配)?如果是,怎么做?
回答 2
Stack Overflow用户
发布于 2019-11-05 14:49:00
它不受QXYSeries的支持。您可以通过查看代码,从QAbstractSeries为您的派生一个新类,即所谓的 QXYDatetimeSeries,它遵循QXYSeries实现的相同内容。您还可能希望更改QXYSeriesPrivate::drawSeriesPointLabels源代码以支持您的行为。不要忘记将您的更改推送到Qt存储库,以便其他人也可以使用它。
Stack Overflow用户
发布于 2019-11-12 12:08:30
正如Soheim所指出的,QtCharts提供的点标签格式对此过于有限。
如果你不想用QtCharts内部工具弄脏你的手,你可以用另一种方式解决你的问题:自己画文字标签。
从QGraphicsObject派生自定义图形项
class PointLabelsItem : public QGraphicsObject
{
    Q_OBJECT
public:
    PointLabelsItem(QtCharts::QChart *parent = nullptr);
    virtual QRectF boundingRect() const;
    virtual void paint(QPainter*, const QStyleOptionGraphicsItem*, QWidget*);

public slots:
    void setRect(const QRectF &area);
    void setAxis(const QAbstractAxis *axis, Qt::Alignment alignment);
    // setter for either source Q*Series or points / point labels

protected:
    QRectF area;
    // const axes*
    // const series* or points/labels
};
在执行过程中:
PointLabelsItem::PointLabelsItem(QtCharts::QChart *parent)
    : QGraphicsObject(parent)
{
    setZValue(10); // put above series
    connect(parent, &QtCharts::QChart::plotAreaChanged,
        this, &PointLabelsItem::setRect);
}

QRectF PointLabelsItem::boundingRect() const
{
    return area;
}

void PointLabelsItem::paint(QPainter *painter, const QStyleOptionGraphicsItem *, QWidget *)
{
    // translate between data coordinates and scene coordinates
    // by making use of `area` and the axes' ranges, OR via
    // qobject_cast<QtCharts::QChart>(parent())->mapToPosition()
    // then draw custom point label texts at the corresp. positions
}

void PointLabelsItem::setRect(const QRectF &newArea)
{
    area = newArea;
    update();
}

void setAxis(const QAbstractAxis *axis, Qt::Alignment alignment)
{
    disconnect(/* old axis member variable */);
    // set corresp. axis member variable here
    connect(axis, &QtCharts::QValueAxis::rangeChanged, this, [this] { update(); });
}
来自外部:
auto pointLabels = new PointLabelsItem(chart);
// set axes, series
那是巴里伯恩。
您还可以决定将QGRaphicsTextItem作为PointLabelsItem的子级(即将this设置为其parent的成员)。通过这种方式,您可以启用用户与标签的交互。
https://stackoverflow.com/questions/58713176
复制相似问题
腾讯云开发者

Copyright © 2013 - 2026 Tencent Cloud. All Rights Reserved. 腾讯云 版权所有
深圳市腾讯计算机系统有限公司 ICP备案/许可证号:粤B2-20090059 ![]() 粤公网安备44030502008569号
粤公网安备44030502008569号
腾讯云计算(北京)有限责任公司 京ICP证150476号 | 京ICP备11018762号