
用Python从日期中提取三维散点图
用Python从日期中提取三维散点图
提问于 2019-11-08 15:39:41
问题:
是否有一种方法可以将天转换为字符串而不是十进制值?同样适用于月份.
注意:我已经访问了这 (Python中带有字符串的三维散点图)的答案,这并不能解决我的问题。
我正在做一个自我项目,在这个项目中,我试图从我从google活动中检索到的数据中为我的通勤创建3D图表。作为参考,我遵循以下指南:https://nvbn.github.io/2018/05/01/commute/
我能够创建基于月+时间和Day +Time属性的信息丰富的2D图表,但是我希望将这2张图表结合起来。
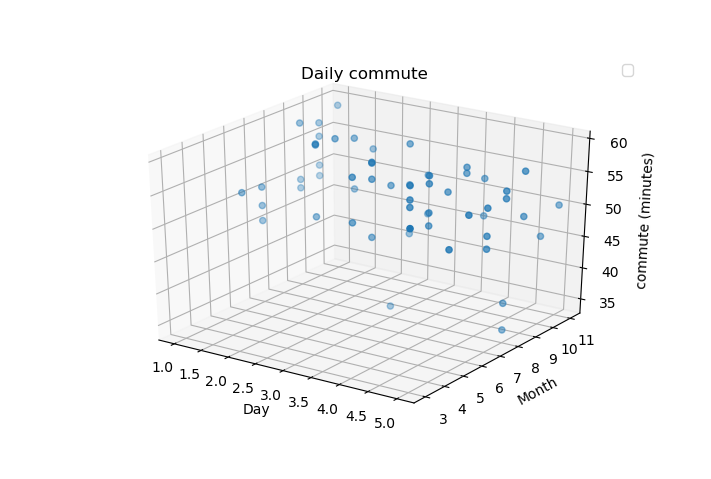
我想要创建的3D图表需要3个属性:Day (Mon/Tue)、Month (Jan/Feb)、Time taken。
考虑到matplotlib不支持图表中的字符串值,我立即使用了日期(0-7)和月份(1-12)的数字。然而,几天来,用十进制值表示图表似乎有点模糊。如下所示
我的当前代码如下所示,检索weekday()以获取日数,并检索每月的month。
# How commute is calculated and grouped
import pandas as pd
#{...}
def get_commute_to_work():
#{...}
 yield Commute_to_work(pd.to_datetime(start.datetime), start.datetime, end.datetime, end.datetime - start.datetime)

#Now creating graph here

fig, ax = pyplot.subplots(subplot_kw={'projection': '3d'})
ax.grid()
ax.scatter([commute.day.weekday() for commute in normalised],
           [commute.day.month for commute in normalised],
           [commute.took.total_seconds() / 60 for commute in normalised])

ax.set(xlabel='Day',ylabel='Month' ,zlabel='commute (minutes)',
       title='Daily commute')
ax.legend()
pyplot.show()注:如果您想查看这段代码的详细信息,可以在这里使用github
回答 1
Stack Overflow用户
回答已采纳
发布于 2019-11-11 13:44:15
您可以尝试这样做(不过,我还没有对3d图进行验证):
x_tick_labels = ['Sun','Mon','Tue','Wed','Thurs', 'Fri', 'Sat']

# Set number of ticks for x-axis
x = np.linspace(1.0, 4.0, 7)  # Why you have 9 days in a week is beyond me
ax.set_xticks(x)
# Set ticks labels for x-axis
ax.set_xticklabels(x_ticks_labels, rotation='vertical', fontsize=18)
你可以重复一个类似的过程几个月。
这个答案的来源是这里。
页面原文内容由Stack Overflow提供。腾讯云小微IT领域专用引擎提供翻译支持
原文链接:
https://stackoverflow.com/questions/58769662
复制相关文章
相似问题
腾讯云开发者

Copyright © 2013 - 2026 Tencent Cloud. All Rights Reserved. 腾讯云 版权所有
深圳市腾讯计算机系统有限公司 ICP备案/许可证号:粤B2-20090059 ![]() 粤公网安备44030502008569号
粤公网安备44030502008569号
腾讯云计算(北京)有限责任公司 京ICP证150476号 | 京ICP备11018762号