
计算一个年代的平均值
计算一个年代的平均值
提问于 2019-11-21 10:13:52
我正在使用MNE工具箱对Python进行脑电数据分析。我是个Python新手,我想知道是否有一种方法来计算一个时代的平均值?所谓“时代”,我的意思是把每一个时代都取下来,然后找出它能给出的平均曲线。(英语不是我的第一语言,所以我希望它是明确的)谢谢你的帮助!
回答 1
Stack Overflow用户
回答已采纳
发布于 2019-11-21 10:37:14
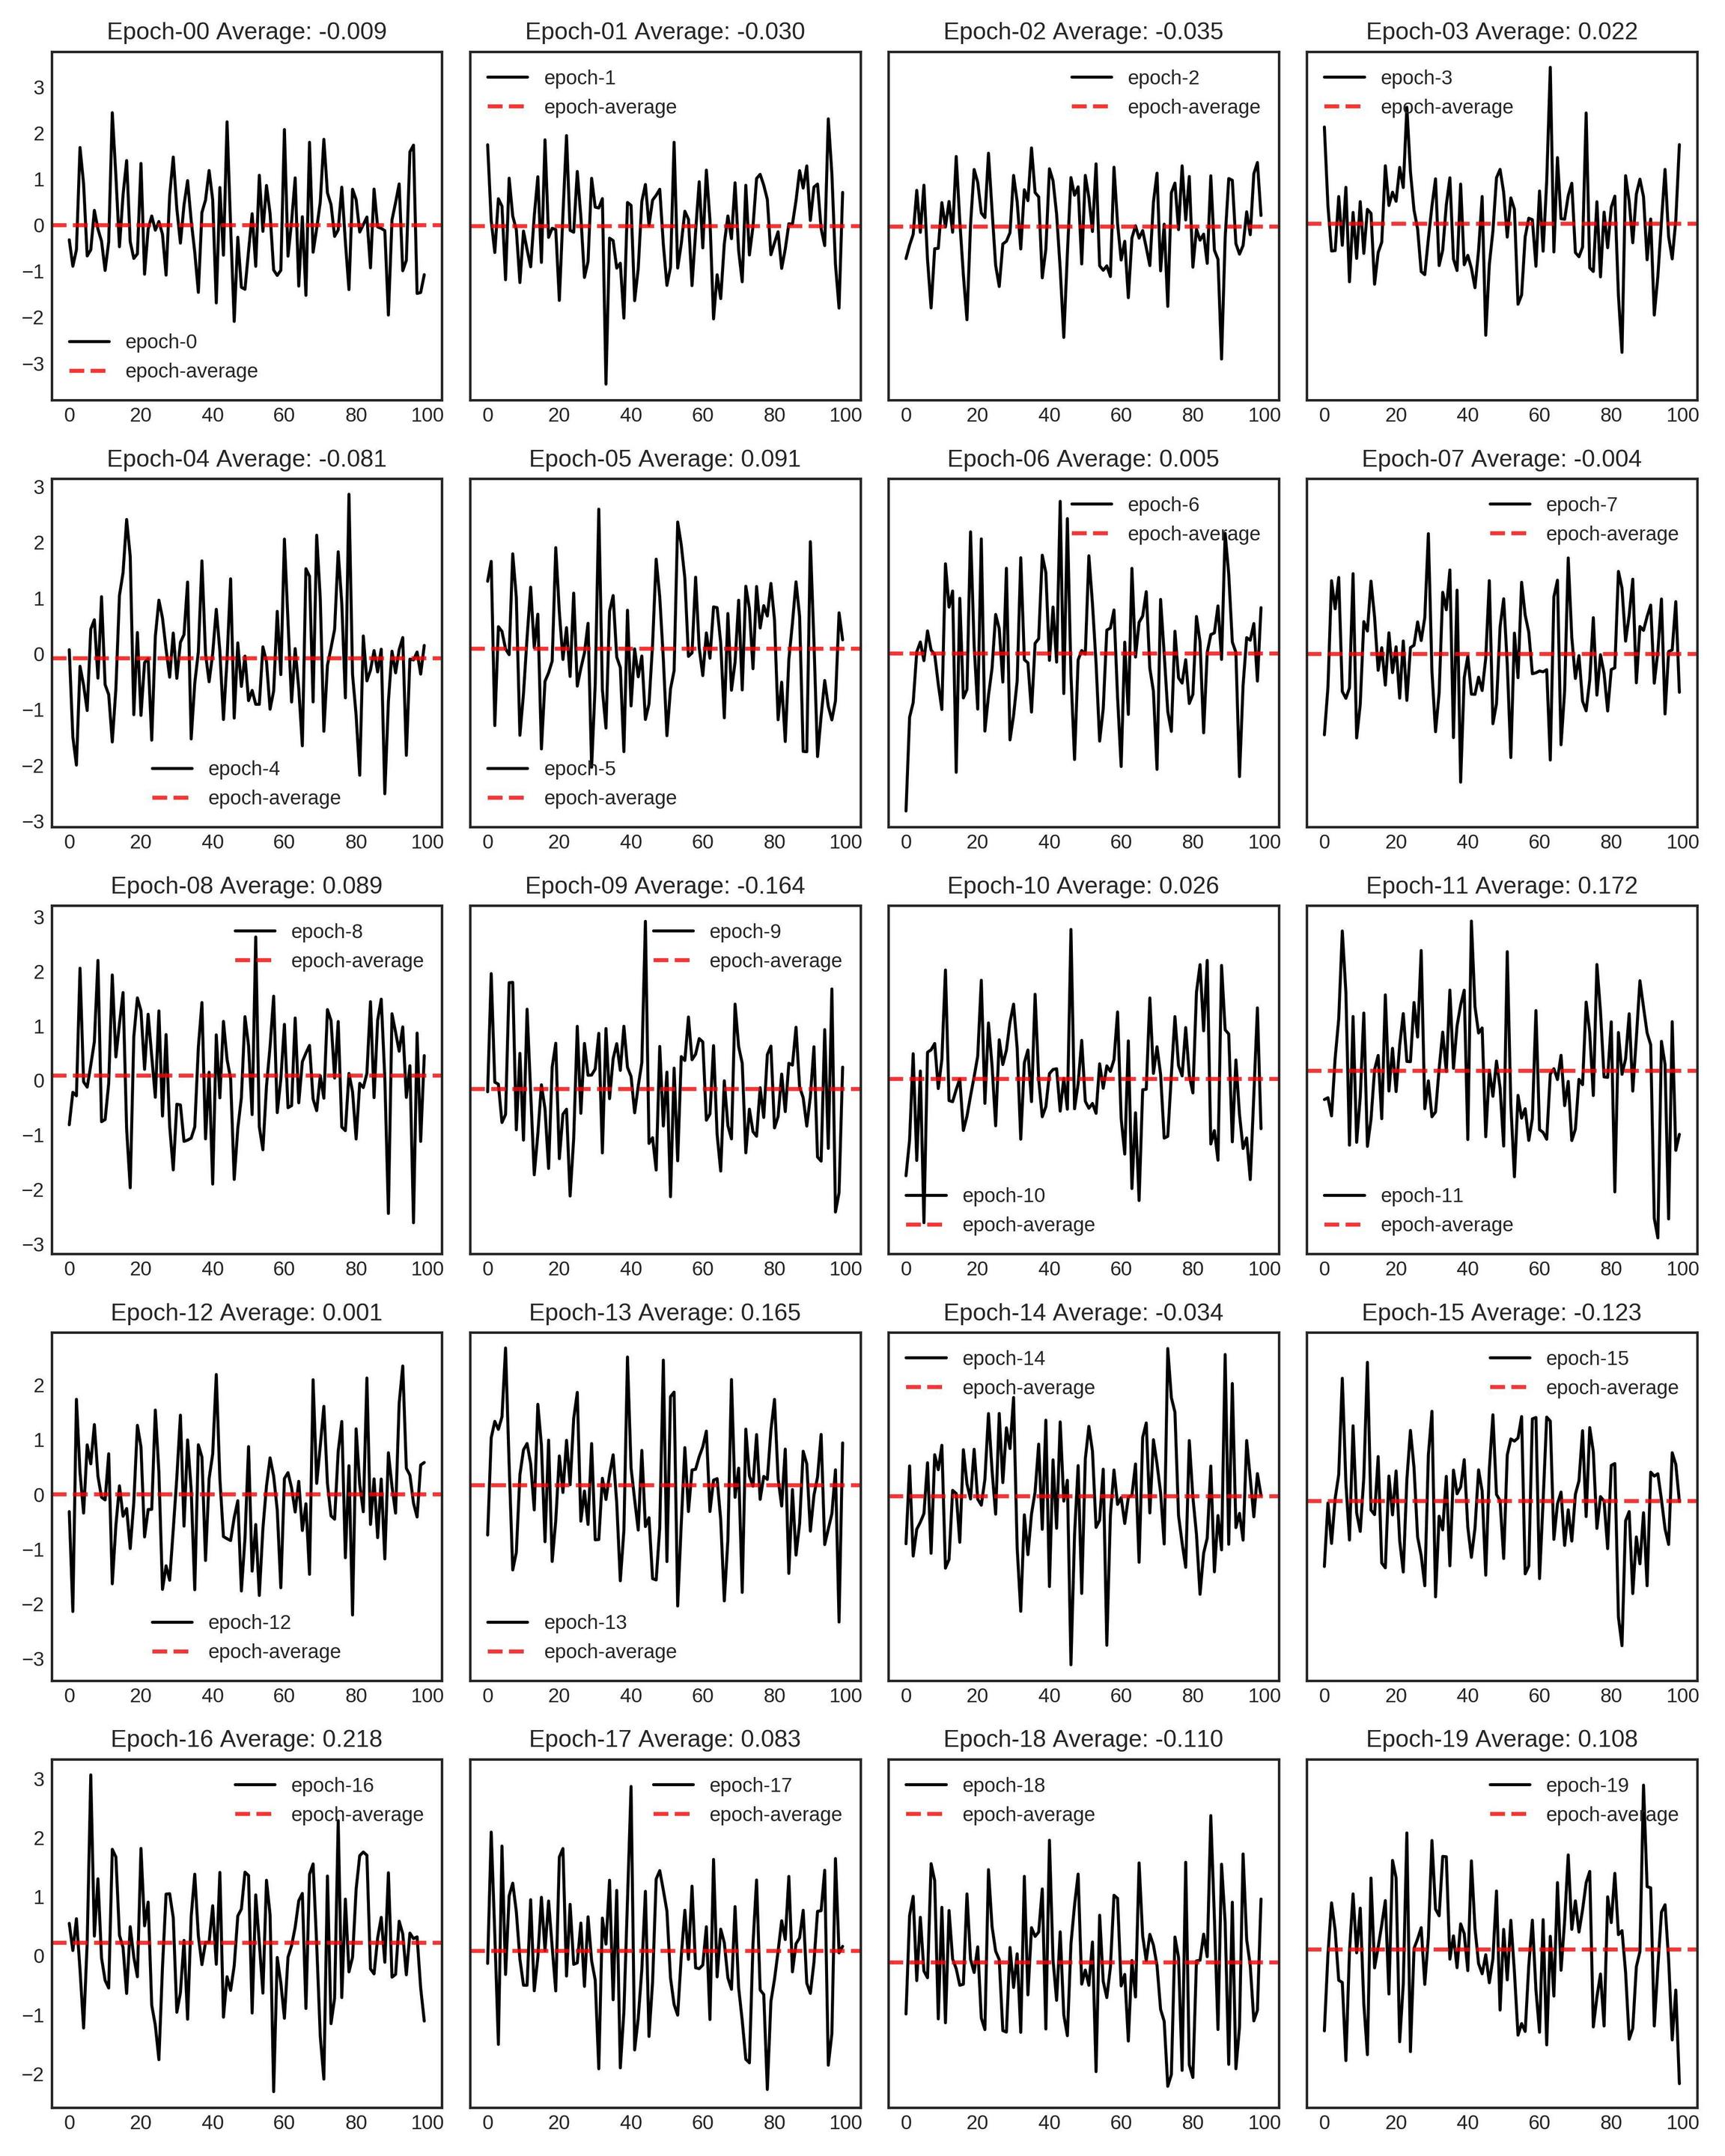
假设每个时代总共有100个数据点,而你有这样的20个数据点。然后,您可以将这些数据重组为(20,100):20行和100列。你想要的是每个时代的平均水平。我假设您不需要滚动平均值(移动平均值: MA);如果您需要MA,请在评论部分留下注释。
让我们制作一些虚拟数据,并将这一逻辑应用于它。
import numpy as np
import matplotlib.pyplot as plt

%matplotlib inline
%config InlineBackend.figure_format = 'svg' # 'svg', 'retina'
plt.style.use('seaborn-white')

x = np.random.randn(20*100) # assume this is your original data
x = x.reshape((20,100)) # now we reshape it: here each row is an epoch
epoch_average = x.mean(axis=1)

# Plot figure to show results
show_figure = True
if show_figure:
    fig, axs = plt.subplots(nrows=5, ncols=4, figsize=(12,15), sharey='row')
    for i, (ax, x_epoch) in enumerate(zip(axs.flatten(), x)):
        plt.sca(ax)
        plt.plot(np.arange(x.shape[1]), x_epoch, 'k-', label='epoch-{}'.format(i))
        plt.axhline(epoch_average[i], label='epoch-average', color='red', alpha=0.8, lw=2.0, ls='--')
        plt.legend()
        plt.title('Epoch-{} Average: {:.3f}'.format(str(i).zfill(2), epoch_average[i]))

    plt.tight_layout()
    plt.show()
    fig.savefig('output.png', dpi=300)
页面原文内容由Stack Overflow提供。腾讯云小微IT领域专用引擎提供翻译支持
原文链接:
https://stackoverflow.com/questions/58972395
复制相关文章
相似问题
腾讯云开发者

Copyright © 2013 - 2026 Tencent Cloud. All Rights Reserved. 腾讯云 版权所有
深圳市腾讯计算机系统有限公司 ICP备案/许可证号:粤B2-20090059 ![]() 粤公网安备44030502008569号
粤公网安备44030502008569号
腾讯云计算(北京)有限责任公司 京ICP证150476号 | 京ICP备11018762号