
如何打开矩阵条形图中的科学符号?
如何打开矩阵条形图中的科学符号?
提问于 2019-11-21 07:01:46
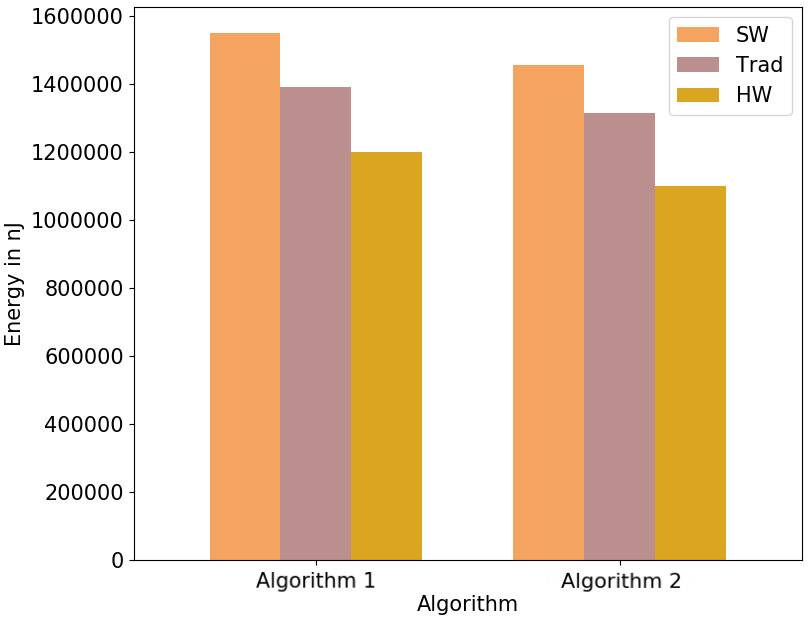
我试图在这幅图中打开科学符号,这样y轴上的数字就不会占用太多的空间。
目前我的代码是:
import matplotlib.pyplot as plt
import matplotlib as mpl
import pandas as pd

mpl.rcParams.update({'font.size':15})
mpl.rcParams.update({'legend.columnspacing':0.5})

energy_cm = 1550835.86856494
energy_fm = 1456129.29966378
energy_cm_trad = 1393026.50949191
energy_fm_trad = 1314814.95236864
energy_cm_hw = 1200000
energy_fm_hw = 1100000

data_energy = { 'Algorithm' : ['Algorithm 1', 'Algorithm 2'],
       'SW' : [energy_cm, energy_fm],
       'HW' : [energy_cm_hw, energy_fm_hw],
       'Trad' : [energy_cm_trad, energy_fm_trad]
    }

df_energy = pd.DataFrame(data_energy)

width = 0.7
fig = plt.figure(figsize=(8, 8))
ax = plt.axes()
df_energy[['Algorithm', 'SW', 'Trad', 'HW']].set_index('Algorithm').plot(kind='bar', legend=True, width=width, rot=0, ax=ax, color=('sandybrown','rosybrown', 'goldenrod','indianred','tomato','r'))

ax.set_ylabel('Energy in nJ')

ax.ticklabel_format(style='sci', axis='y')
# ax.yaxis.set_major_formatter(scientific_formatter)
# ax.ticklabel_format(useOffset=True, axis='y')

fig.tight_layout()
plt.show()
这就是相应的情节:
基本上我的问题是与此相反。
我有相同的错误消息,并通过更改
ax.ticklabel_format(style='sci')
至
ax.ticklabel_format(style='sci', axis='y')
我尝试使用FuncFormatter来产生定制的科学符号,但是我不喜欢这个结果,因为轴上的每一个滴答都用指数标记。
而不是将指数/偏移量简单地标记在轴的顶部,如下面的图像(来自互联网)。
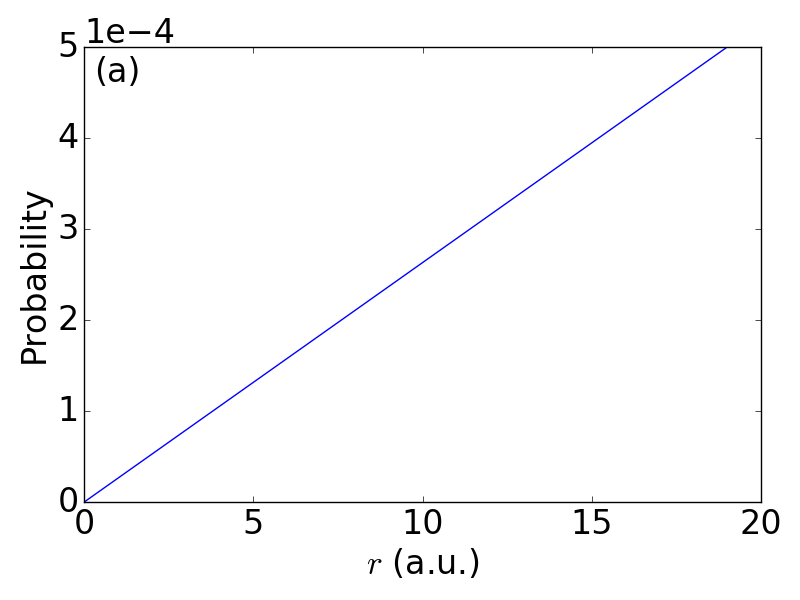
如何从matplotlib获得使用默认科学符号的绘图?
回答 2
Stack Overflow用户
回答已采纳
发布于 2019-11-21 07:50:58
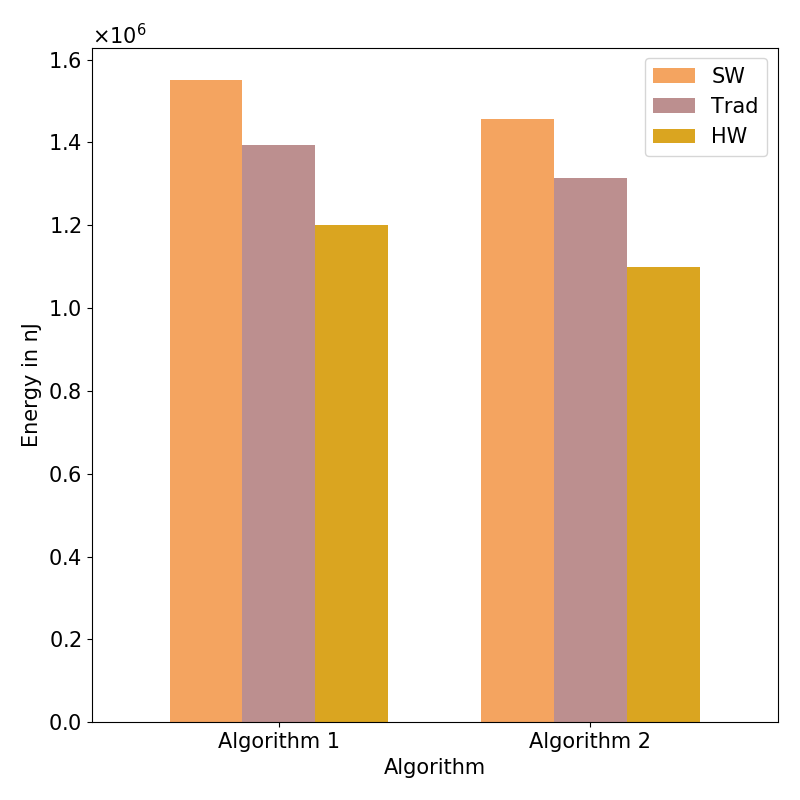
您可以在plt.show()之前添加这3行
mf = mpl.ticker.ScalarFormatter(useMathText=True)
mf.set_powerlimits((-2,2))
plt.gca().yaxis.set_major_formatter(mf)也请检查此链接中的set_powerlimits()
Stack Overflow用户
发布于 2019-11-21 11:52:26
您需要使用scilimits参数来设置使用偏移量的限制。
ax.ticklabel_format(style='sci', axis='y', useOffset=True, scilimits=(0,0))页面原文内容由Stack Overflow提供。腾讯云小微IT领域专用引擎提供翻译支持
原文链接:
https://stackoverflow.com/questions/58969040
复制相关文章
相似问题
腾讯云开发者

Copyright © 2013 - 2026 Tencent Cloud. All Rights Reserved. 腾讯云 版权所有
深圳市腾讯计算机系统有限公司 ICP备案/许可证号:粤B2-20090059 ![]() 粤公网安备44030502008569号
粤公网安备44030502008569号
腾讯云计算(北京)有限责任公司 京ICP证150476号 | 京ICP备11018762号