
如何用拟图法绘制曲面图后的线
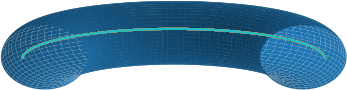
我想在环面内画一条线,这条线是我用曲面画出来的。这条线在环面内是不可见的--就像环面的内侧一样,只能在环面的“末端”看到(我切断了环面的一半)。然而,我画的线在任何地方都是可见的(正如你在图中所看到的)。
我使用了以下代码:
import numpy as np
import matplotlib.pyplot as plt
from mpl_toolkits.mplot3d import Axes3D

# theta: poloidal angle | phi: toroidal angle
# note: only plot half a torus, thus phi=0...pi
theta = np.linspace(0, 2.*np.pi, 200)
phi   = np.linspace(0, 1.*np.pi, 200)
theta, phi = np.meshgrid(theta, phi)

# major and minor radius
R0, a = 3., 1.

# torus parametrization
x_torus = (R0 + a*np.cos(theta)) * np.cos(phi)
y_torus = (R0 + a*np.cos(theta)) * np.sin(phi)
z_torus = a * np.sin(theta)

# parametrization for a circular line at theta=0
x_circle = (R0-a/2. + a*np.cos(.0)) * np.cos(phi)
y_circle = (R0-a/2. + a*np.cos(.0)) * np.sin(phi)
z_circle = a * np.sin(.0)

fig = plt.figure()
ax1 = fig.add_subplot(111, projection='3d')

# plot half of a circular line
ax1.plot3D( x_circle, y_circle, z_circle )

# plot half of torus
ax1.plot_surface( x_torus, y_torus, z_torus )

ax1.view_init(elev=15, azim=270)
ax1.set_xlim( -3, 3)
ax1.set_ylim( -3, 3)
ax1.set_zlim( -3, 3)
ax1.set_axis_off()

plt.show()
我认为先画一条线就可以解决我的问题,但它并不能解决问题。任何建议或帮助如何改变这条线的行为都是非常感谢的。
numpy.__version__     : 1.12.1
matplotlib.__version__: 2.0.0回答 1
Stack Overflow用户
发布于 2019-11-22 21:46:49
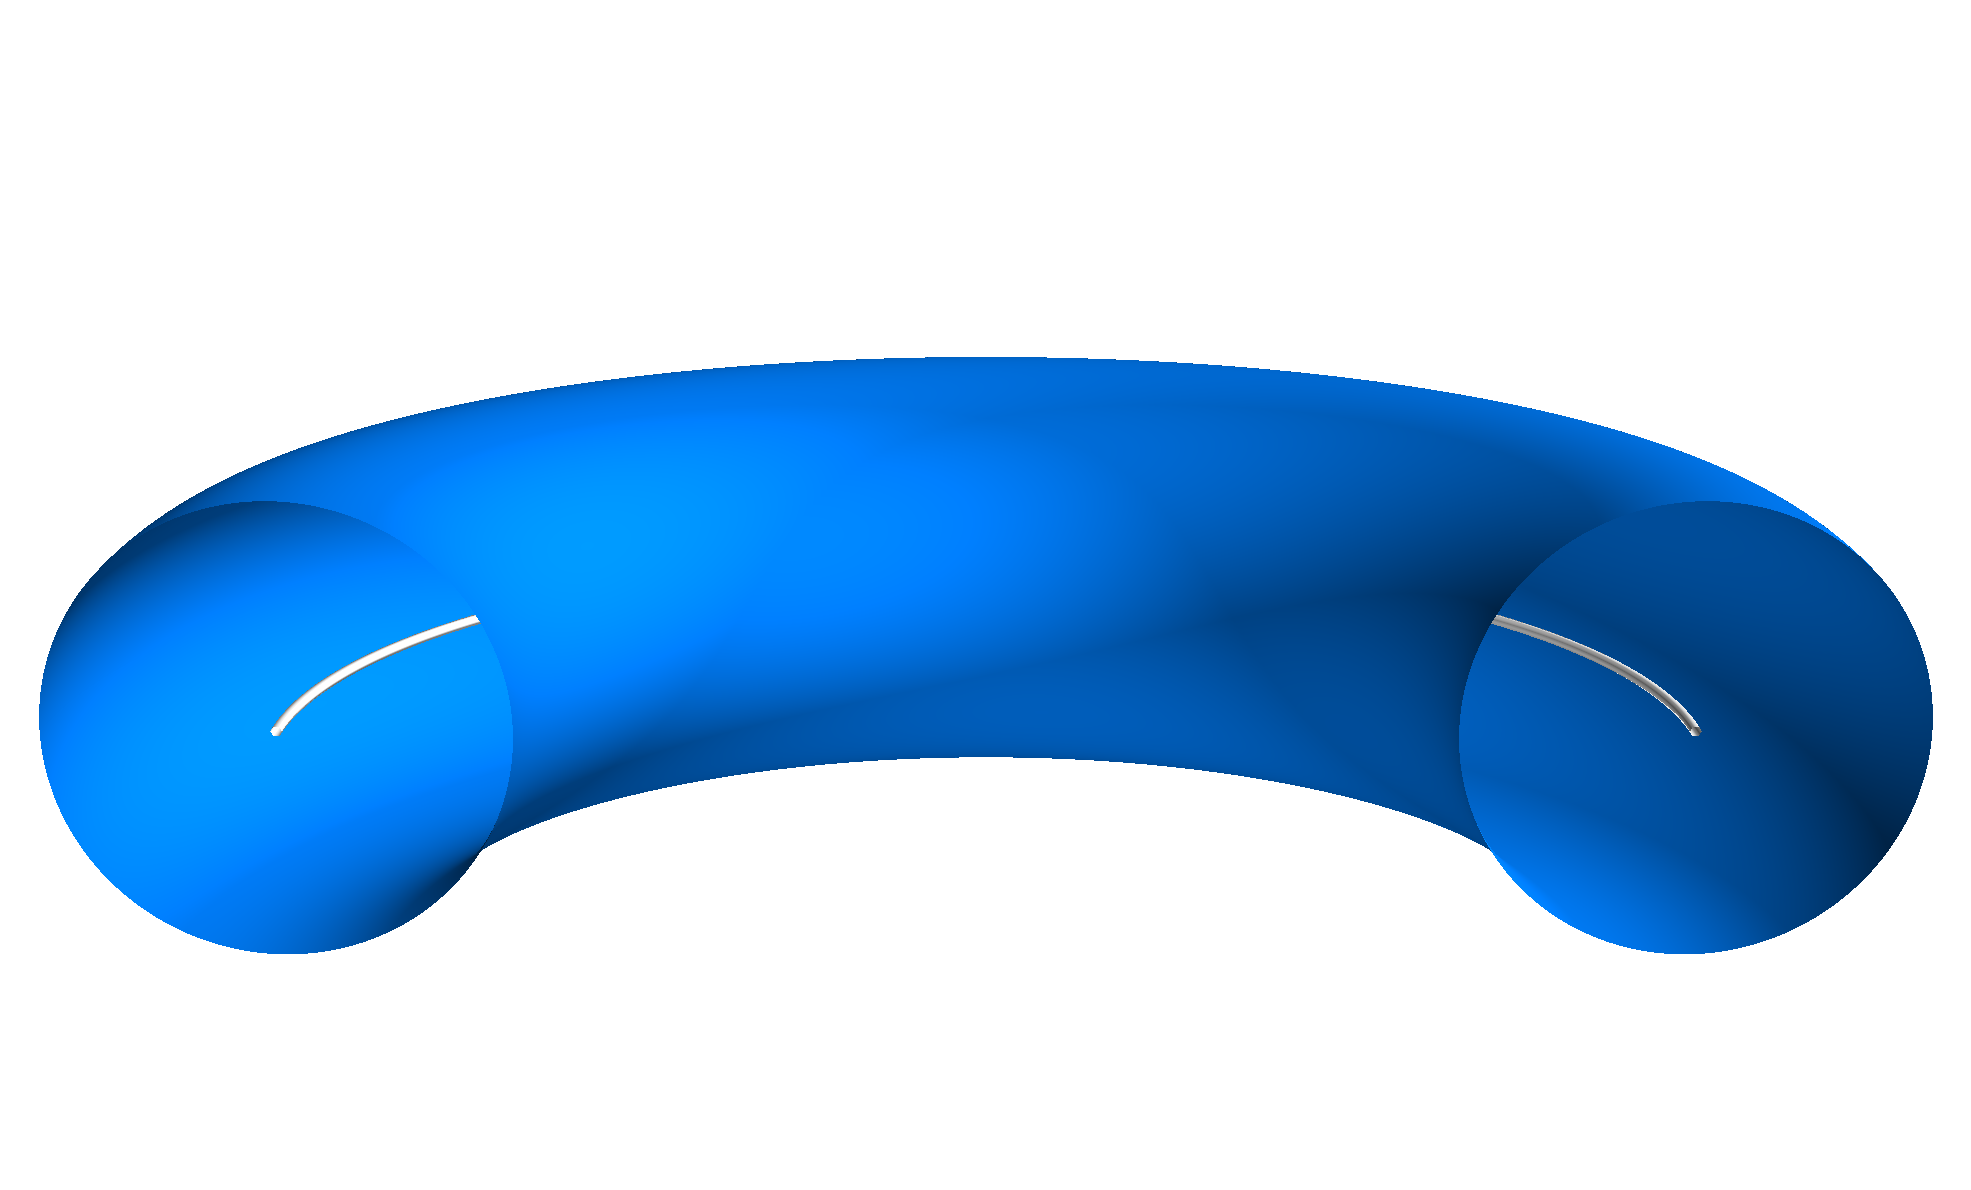
选项一-使用Mayavi
要做到这一点,更容易的方法是使用马亚维库。这与matplotlib非常相似,这个脚本唯一有意义的区别是传递给plot3d来绘制该行的x、y和z数组应该是1d,而view设置的方式有点不同(取决于它是在绘图之前还是之后设置,而alt/az是从不同的引用中度量的)。
import numpy as np
import mayavi.mlab as mlab
from mayavi.api import OffScreenEngine
mlab.options.offscreen = True

# theta: poloidal angle | phi: toroidal angle
# note: only plot half a torus, thus phi=0...pi
theta = np.linspace(0, 2.*np.pi, 200)
phi   = np.linspace(0, 1.*np.pi, 200)

# major and minor radius
R0, a = 3., 1.

x_circle = R0 * np.cos(phi)
y_circle = R0 * np.sin(phi)
z_circle = np.zeros_like(x_circle)

# Delay meshgrid until after circle construction
theta, phi = np.meshgrid(theta, phi)
x_torus = (R0 + a*np.cos(theta)) * np.cos(phi)
y_torus = (R0 + a*np.cos(theta)) * np.sin(phi)
z_torus = a * np.sin(theta)

mlab.figure(bgcolor=(1.0, 1.0, 1.0), size=(1000,1000))
mlab.view(azimuth=90, elevation=105)

mlab.plot3d(x_circle, y_circle, z_circle)
mlab.mesh(x_torus, y_torus, z_torus, color=(0.0, 0.5, 1.0))
mlab.savefig("./example.png")
# mlab.show() has issues with rendering for some setups
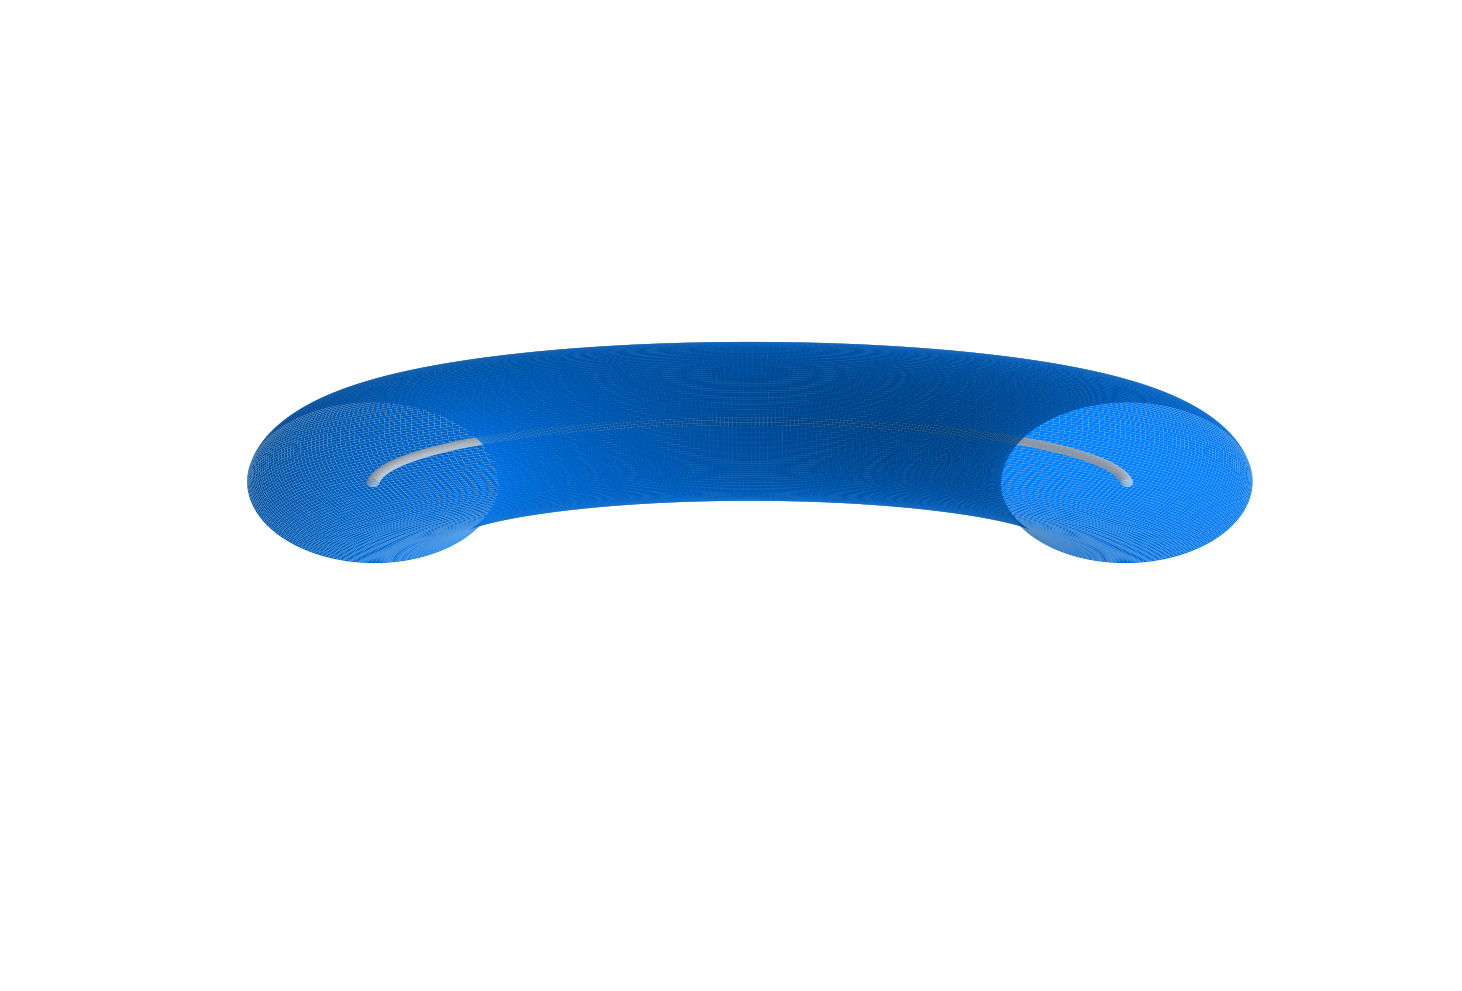
选项二-使用matplotlib (加上一些附加的不愉快)
如果你不能使用mayavi,就有可能用matplotlib来完成它,它只是.不愉快。该方法基于在表面之间创建透明的“桥梁”,然后将它们绘制成一个表面。的思想。对于更复杂的组合来说,这并不简单,但是下面是一个有一条线的环面的例子,它非常简单。
import numpy as np
import matplotlib.pyplot as plt
from mpl_toolkits.mplot3d import Axes3D

theta = np.linspace(0, 2.*np.pi, 200)
phi   = np.linspace(0, 1.*np.pi, 200)
theta, phi = np.meshgrid(theta, phi)

# major and minor radius
R0, a = 3., 1.
lw = 0.05 # Width of line

# Cue the unpleasantness - the circle must also be drawn as a toroid
x_circle = (R0 + lw*np.cos(theta)) * np.cos(phi)
y_circle = (R0 + lw*np.cos(theta)) * np.sin(phi)
z_circle = lw * np.sin(theta)
c_circle = np.full_like(x_circle, (1.0, 1.0, 1.0, 1.0), dtype=(float,4))

# Delay meshgrid until after circle construction
x_torus = (R0 + a*np.cos(theta)) * np.cos(phi)
y_torus = (R0 + a*np.cos(theta)) * np.sin(phi)
z_torus = a * np.sin(theta)
c_torus = np.full_like(x_torus, (0.0, 0.5, 1.0, 1.0), dtype=(float, 4))

# Create the bridge, filled with transparency
x_bridge = np.vstack([x_circle[-1,:],x_torus[0,:]])
y_bridge = np.vstack([y_circle[-1,:],y_torus[0,:]])
z_bridge = np.vstack([z_circle[-1,:],z_torus[0,:]])
c_bridge = np.full_like(z_bridge, (0.0, 0.0, 0.0, 0.0), dtype=(float, 4))

# Join the circle and torus with the transparent bridge
X = np.vstack([x_circle, x_bridge, x_torus])
Y = np.vstack([y_circle, y_bridge, y_torus])
Z = np.vstack([z_circle, z_bridge, z_torus])
C = np.vstack([c_circle, c_bridge, c_torus])

fig = plt.figure()
ax = fig.gca(projection='3d')
ax.plot_surface(X, Y, Z, rstride=1, cstride=1, facecolors=C, linewidth=0)
ax.view_init(elev=15, azim=270)
ax.set_xlim( -3, 3)
ax.set_ylim( -3, 3)
ax.set_zlim( -3, 3)
ax.set_axis_off()

plt.show()
Note,在这两种情况下,我都改变了圆圈,使其与环面的主要半径相匹配,以便于演示简单,可以根据需要轻松修改。
https://stackoverflow.com/questions/59000001
复制相似问题
腾讯云开发者

Copyright © 2013 - 2026 Tencent Cloud. All Rights Reserved. 腾讯云 版权所有
深圳市腾讯计算机系统有限公司 ICP备案/许可证号:粤B2-20090059 ![]() 粤公网安备44030502008569号
粤公网安备44030502008569号
腾讯云计算(北京)有限责任公司 京ICP证150476号 | 京ICP备11018762号