
熊猫多类栏的CDF
熊猫多类栏的CDF
提问于 2019-12-02 11:02:02
我正在使用python 空区包来绘制一个关于traval模式(多类)的速度分布的CDF。
data.head()
+---+---------+----------+----------+-------+--------------+------------+
|   | trip_id | distance | duration | speed | acceleration | travelmode |
+---+---------+----------+----------+-------+--------------+------------+
| 0 |  303637 | 5.92     | 0.51     | 3.20  | 0.00173      | metro      |
| 1 |  303638 | 3.54     | 0.22     | 4.44  | 0.00557      | bus        |
| 2 |  303642 | 4.96     | 0.20     | 6.84  | 0.00944      | car        |
| 3 |  303662 | 6.53     | 0.97     | 1.86  | 0.00053      | foot       |
| 4 |  303663 | 40.23    | 0.94     | 11.85 | 0.00349      | car        |
+---+---------+----------+----------+-------+--------------+------------+现在如何为CDF中的每一种模式绘制speed列。所以,
from empiricaldist import Cdf

def decorate_cdf(title, x, y):
    """Labels the axes.

    title: string
    """
    plt.xlabel(x)
    plt.ylabel(y)
    plt.title(title)

for name, group in data.groupby('travelmode'):
    Cdf.from_seq(group.speed).plot()

title, x, y = 'Speed by mode','speed (km/h)', 'CDF'
decorate_cdf(title,x,y)
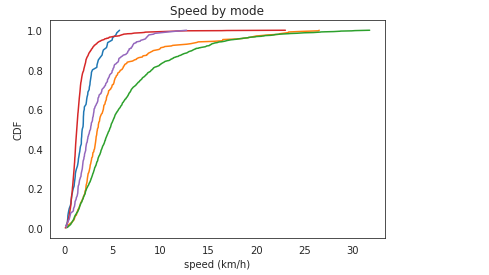
然后,我如何在每个情节中添加图例,这样我就可以知道哪个情节是什么模式的?
回答 2
Stack Overflow用户
回答已采纳
发布于 2019-12-02 12:49:40
使用matplotlib的pyplot.legend命令:
plt.legend(data.groupby('travelmode').groups.keys())Stack Overflow用户
发布于 2020-06-05 06:15:07
您可以简单地将参数"label =“添加到与Cdf关联的绘图方法中,如下所示:
Cdf.from_seq(group.speed).plot(label = 'metro') 或者在你的情况下传递一个列表,而不是“地铁”
页面原文内容由Stack Overflow提供。腾讯云小微IT领域专用引擎提供翻译支持
原文链接:
https://stackoverflow.com/questions/59137549
复制相关文章
相似问题
腾讯云开发者

Copyright © 2013 - 2026 Tencent Cloud. All Rights Reserved. 腾讯云 版权所有
深圳市腾讯计算机系统有限公司 ICP备案/许可证号:粤B2-20090059 ![]() 粤公网安备44030502008569号
粤公网安备44030502008569号
腾讯云计算(北京)有限责任公司 京ICP证150476号 | 京ICP备11018762号