
如何调整plot_tree图的大小以使其可读性?
如何调整plot_tree图的大小以使其可读性?
提问于 2019-12-04 11:11:58
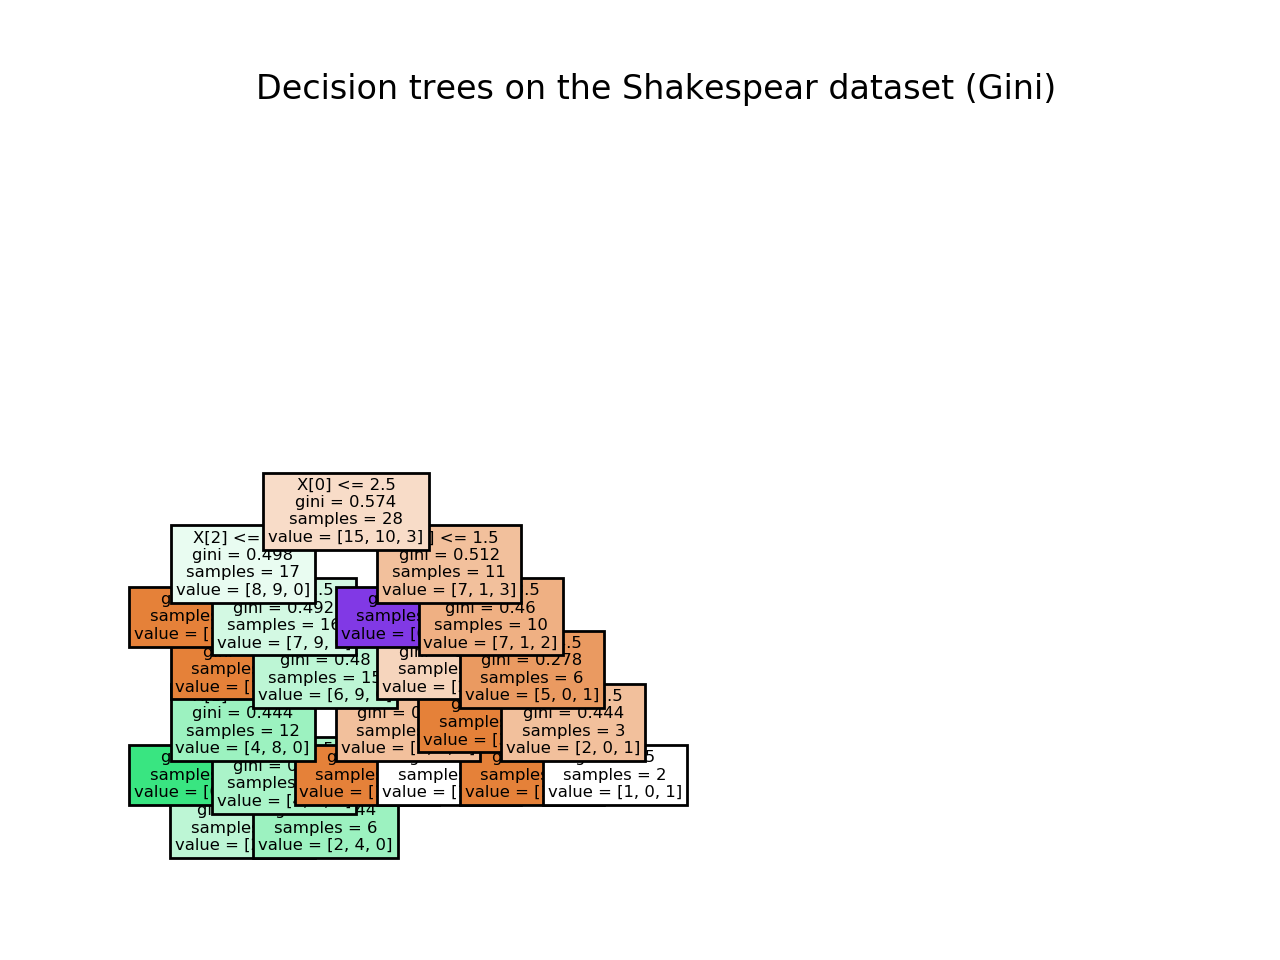
我试图用plot_tree从sklearn绘制一个matplotlib对象,但是我的树图看起来不太好。我的树看起来被压扁了:
以下是我的代码:
from sklearn import tree
from sklearn.model_selection import cross_val_score
from sklearn.metrics import accuracy_score
import matplotlib.pyplot as plt

# create tree object
model_gini_class = tree.DecisionTreeClassifier(criterion='gini')

# train the model using the training sets and check score
model_gini_class.fit(X_train, y_train)
model_gini_class.score(X_train, y_train)

# predict output
predicted_gini_class = model_gini_class.predict(X_test)

plt.figure()
tree.plot_tree(model_gini_class, filled=True)
plt.title("Decision trees on the Shakespear dataset (Gini)")
plt.show() # the tree looks squished?
所以我的问题是:
- 能告诉我如何调整
sklearnplot_tree对象的大小使它看起来不受挤压吗?
谢谢,
回答 3
Stack Overflow用户
发布于 2019-12-19 08:46:29
这可能会有帮助
plt.figure(figsize=(10,10))Stack Overflow用户
发布于 2021-09-21 19:00:32
你可以做两件事:
方法1
# Decision tree
classifier = DecisionTreeClassifier()
classifier.fit(X_train, y_train)


_, ax = plt.subplots(figsize=(30,30)) # Resize figure
plot_tree(classifier, filled=True, ax=ax)
plt.show()
方法2
# Decision tree
classifier = DecisionTreeClassifier()
classifier.fit(X_train, y_train)

plt.figure(figsize=(30, 30) # Resize figure
plot_tree(classifier, filled=True)
plt.show()
不管你喜欢用什么
Stack Overflow用户
发布于 2020-09-28 09:49:27
这可能会有帮助
from matplotlib import pyplot as plt
fig, axes = plt.subplots(nrows = 1,ncols = 1,figsize = (5,5), dpi=300)
tree.plot_tree(model_gini_class, filled=True)页面原文内容由Stack Overflow提供。腾讯云小微IT领域专用引擎提供翻译支持
原文链接:
https://stackoverflow.com/questions/59174665
复制相关文章
相似问题
腾讯云开发者

Copyright © 2013 - 2026 Tencent Cloud. All Rights Reserved. 腾讯云 版权所有
深圳市腾讯计算机系统有限公司 ICP备案/许可证号:粤B2-20090059 ![]() 粤公网安备44030502008569号
粤公网安备44030502008569号
腾讯云计算(北京)有限责任公司 京ICP证150476号 | 京ICP备11018762号