
标签决策树
我需要做一个决策树,并通过图表上的标签来表示数据(如两幅插图中所示)。我对决策树没有问题,不幸的是,这些点没有被输入到图表中。我尝试过对代码进行几次修改。代码来自scikit学习网站在虹膜数据集中绘制决策树的决策面
下面(来自excel文件)使用的数据示例(X、Y、C5) :
Path = "Documents/Apprentissage/Python/Script/ClustAllRepres12.xlsx"
Wordbook = xlrd.open_workbook(Path)
Sheet = Wordbook.sheet_by_index(0)

X=[]
Y=[]
C5=[]

for i in range(1, Sheet.nrows):
    X.append(Sheet.cell_value(i, 0))
    Y.append(Sheet.cell_value(i, 1))
    C5.append(Sheet.cell_value(i, 8))

X
Out[]:8.0,9.0,9.0,9.0,9.0,10.0,11.0,11.0,11.0,11.0,11.0,12.0,12.0,12.0,12.0,12.0,12.0,12.0,13.0,13.0,13.0,14.0,14.0,14.0,15.0,15.015.0,15.0,16.0,16.0,16.0,17.0,17.0,17.0,17.0,17.0,17.0,17.0,18.0,18.0,18.0,18.0,19.0,19.0,19.0,19.0,19.0,19.0,20.0,21.0,21.0,22.0
type(X)Out[]:列表
YOut[]:45.0,17.0,18.0,24.0,25.0,27.0,36.0,38.0,39.0,24.0,37.0,40.0,24.0,31.0,35.0,36.0,37.0,39.0,32.0,33.0,35.0,43.0,27.0,31.0,35.0,42.0、18.0、39.0、43.0、31.0、42.0、28.0、32.0、35.0、43.0、51.0、52.0、17.0、19.0、53.0、49.0、51.0、53.0、58.0、16.0、58.0、59.0、50.0、52.0、54.0
type(Y)Out[]:列表
C5Out[]:2.0、4.0、3.0、3.0、3.0、4.0、3.0、3.0、3.0、3.0、3.0、3.0、3.0、3.0、3.0、3.0、3.0、3.0、3.0、3.0、3.0、1.0、4.0、1.0、1.0、1.0,1.0、1.0、3.0、1.0、3.0、1.0、5.0、1.0、3.0、1.0、1.0、4.0、4.0、1.0、5.0、1.0、5.0、2.0、5.0、5.0、5.0、5.0、5.0、5.0
type(C5)Out[]:列表
有以下代码,来自scikit学习网站:
import pandas as pd
import numpy as np
import xlrd
import matplotlib.pyplot as plt

df_list = pd.DataFrame(
    {'X': X,
     'Y': Y,
    })
df = df_list.iloc[:,0:2].values  #transform to float type

import sklearn
from sklearn.tree import DecisionTreeClassifier, plot_tree

#parameters
n_classes = 5
plot_colors = "ryb"
plot_step = 0.02

for pairidx, pair in enumerate([[0, 1], [0, 2], [0, 3],[1, 2], [1, 3], [2, 3]]):
    # We only take the two corresponding features
    X = df #gives better result without [:, pair]
    y = C5

#train
clf = DecisionTreeClassifier().fit(X, y)

#plot the decision boundary
plt.subplot(2, 3, pairidx +1)
x_min, x_max = X[:, 0].min() - 1, X[:, 0].max() + 1
y_min, y_max = X[:, 1].min() - 1, X[:, 1].max() + 1
xx, yy = np.meshgrid(np.arange(x_min, x_max, plot_step),
                     np.arange(y_min, y_max, plot_step))
plt.tight_layout(h_pad=0.5, w_pad=0.5, pad=2.5)

Z = clf.predict(np.c_[xx.ravel(), yy.ravel()])
Z = Z.reshape(xx.shape)
cs = plt.contourf(xx, yy, Z, cmap=plt.cm.RdYlBu)

# Plot the training points
for i, color in zip(range(n_classes), plot_colors):
    idx = np.where(y == i)
    plt.scatter(X[idx, 0], X[idx, 1], c=color, label=C5[i],
                cmap=plt.cm.RdYlBu, edgecolor='black', s=15)
plt.suptitle("Decision surface of a decision tree using paired features")
plt.legend(loc='lower right', borderpad=0, handletextpad=0)
plt.axis("tight")
plt.figure()
clf = DecisionTreeClassifier().fit(df_list, C5)
plot_tree(clf, filled=True)
plt.show(),我有一个图:
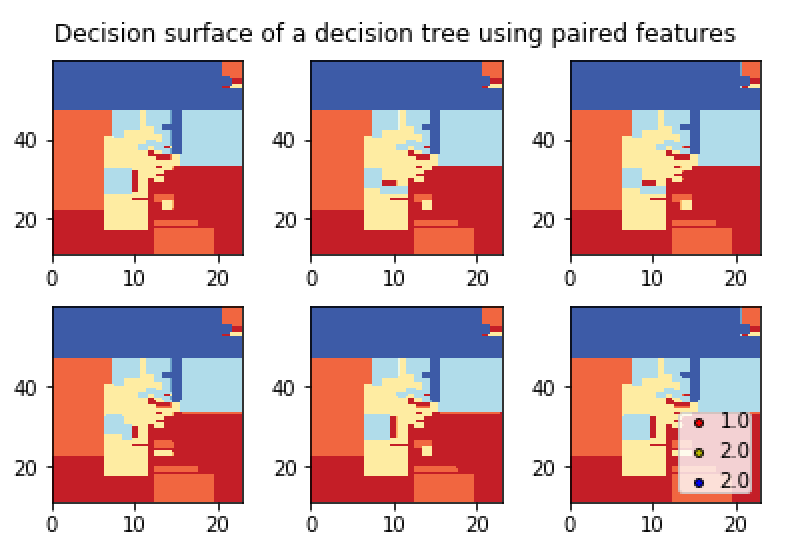
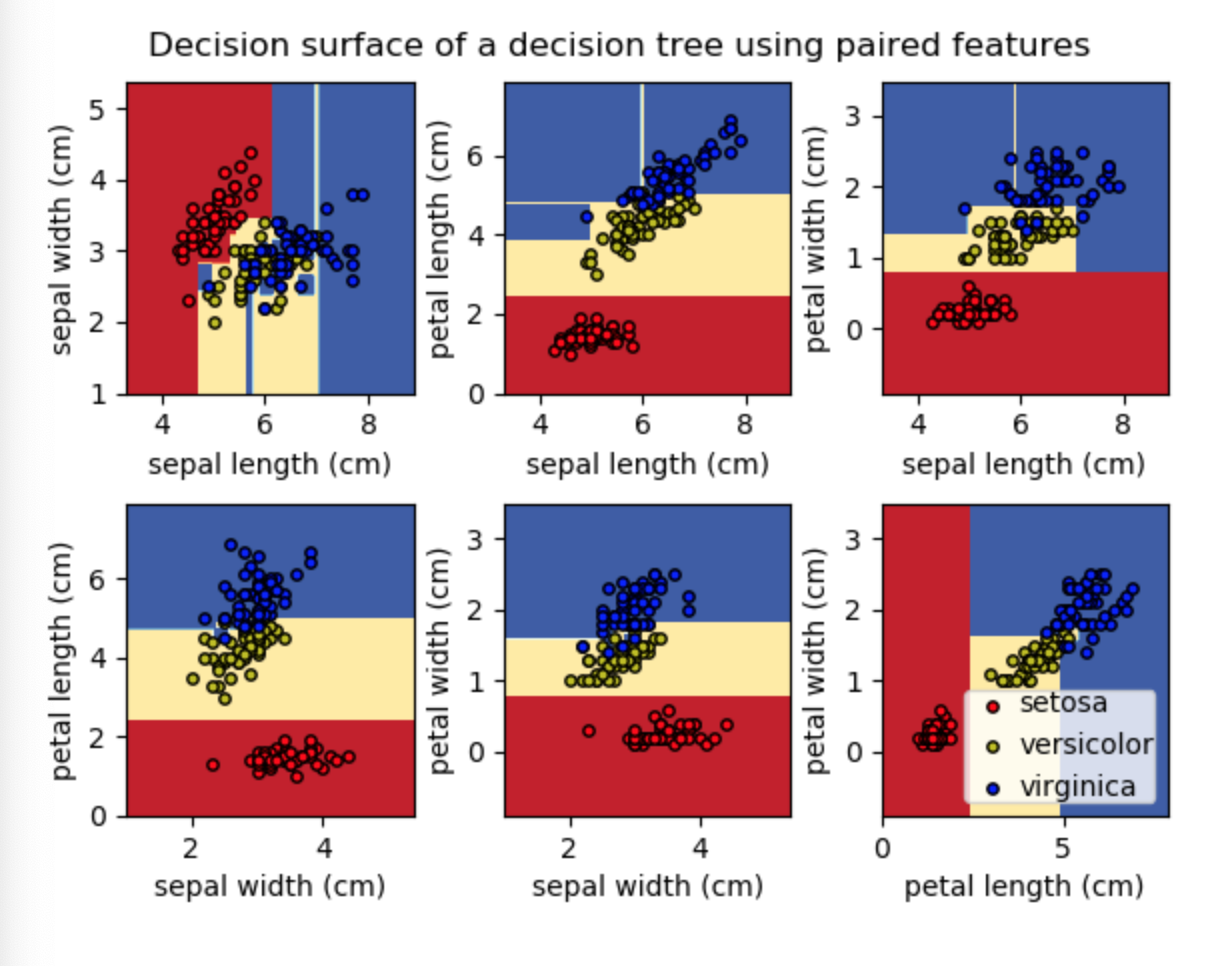
如你所见,这些点不是用图表来表示的。我给一个等待结果的例子:
回答 1
Stack Overflow用户
发布于 2019-12-12 02:41:56
idx = np.where(y == i)
在这一行中,y是一个列表,为了返回等于i(变量)的列表索引,只需将列表转换为数组,一切都将正常工作。
因此,在绘制散点图之前,只需添加这一行即可。
**y = np.asarray(y)** # convert list to array since where will work for array only
# Plot the training points
for i, color in .....https://stackoverflow.com/questions/59255288
复制相似问题
腾讯云开发者

Copyright © 2013 - 2026 Tencent Cloud. All Rights Reserved. 腾讯云 版权所有
深圳市腾讯计算机系统有限公司 ICP备案/许可证号:粤B2-20090059 ![]() 粤公网安备44030502008569号
粤公网安备44030502008569号
腾讯云计算(北京)有限责任公司 京ICP证150476号 | 京ICP备11018762号