
如何用GEKKO描述离散参数?
我有一个有10个方程的模型,描述了一个进料间歇生物反应器。基本上,每24小时添加一次“食物”(葡萄糖和其他成分)到系统中。我的问题是,这个喂食过程目前被建模为两个时间步骤(delta_T)的流量(L/H),而不是单一的离散食物添加(delta_T = 0)。
葡萄糖方程就是这样的:
e4 = m.Intermediate(**(Fi/V)*SG** - (Fo/V)*G + (-mu/YXG - mG)*XV)

m.Equation(G.dt() == e4)其中G为生物反应器中葡萄糖浓度(mM),Fi为输入进料速率(L/h),V为生物反应器体积(L),SG为饲料中葡萄糖浓度(mM)。
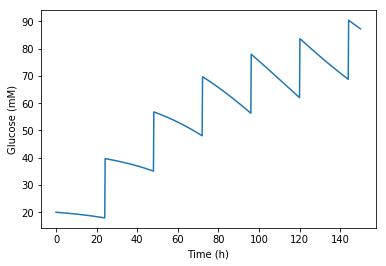
我通过调用这个delta_T = 0.2 hours使系统变得可行,换句话说,葡萄糖浓度连续(而不是即时)从时间上的G1 t1上升到G2的time t1 + 0.2h。如果我试图降低这个delta_T,系统就会显示出一个非常奇怪的行为。
时间排列如下:.,19.5,20.0,20.5,21.0,21.5,22.0,22.5,23.0,23.5,24.0,24.2,24.5,25.0,.
它是按0.5h的步骤变化的,每24小时,当我在生物反应器中添加葡萄糖时,我强迫下一个步骤只有0.2长,而不是0.5。我要这个三角洲是0。
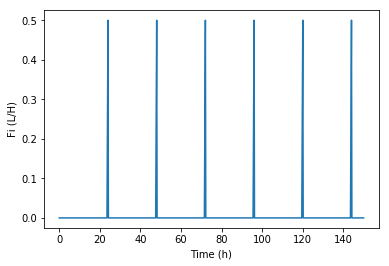
我的喂食率是这样的:
. 0.5,0.0,0.0,0.0,0.0.
不管怎么说,我可以让这个喂食过程离散下来吗?完整的代码如下所示。谢谢!!
import numpy as np
from gekko import GEKKO
import matplotlib.pyplot as plt
import pandas as pd

m = GEKKO(remote=False)    # create GEKKO model

#constants 3L fed-batch
KdQ = 0.001        #degree of degradation of glutamine (1/h)
mG = 1.1e-10   #glucose maintenance coefficient (mmol/cell/hour)
YAQ = 0.90         #yield of ammonia from glutamine
YLG = 2            #yield of lactate from glucose
YXG = 2.2e8    #yield of cells from glucose (cells/mmol)
YXQ = 1.5e9    #yield of cells from glutamine (cells/mmol)
KL = 150           #lactate saturation constant (mM)
KA = 40            #ammonia saturation constant (mM)
Kdmax = 0.01       #maximum death rate (1/h)
mumax = 0.044      #maximum growth rate (1/h)
KG = 1             #glucose saturation constant (mM)
KQ = 0.22          #glutamine saturation constant (mM)
mQ = 0             #glutamine maintenance coefficient (mmol/cell/hour)
kmu = 0.01         #intrinsic death rate (1/h)
Klysis = 2e-2  #rate of cell lysis (1/h)
Ci_star = 100      #inhibitor saturation concentration (mM)
qi = 2.5e-10   #specific inhibitor production rate (1/h)

N_HOURS = 150 #Number of hours of the experiment
TIME_STEP = 0.5
feed_small_delta_t = 0.2

#create time array. It will be from 0 to N_HOURS, with time step TIME_STEP,
#and every 24h, there will be a feed_small_delta_t
t = []
for i in range(int(N_HOURS/TIME_STEP +1)):
    t_value = i*TIME_STEP
    t.append(t_value)

    if t_value%24 == 0:
        t.append(t_value + feed_small_delta_t)

m.time = t

#Create input feed-rate array
Fi = np.zeros(len(t))
for i in range(1,len(t)):
    if t[i]%(24) == 0:
        Fi[i] = 0.1/feed_small_delta_t #it is divided by feed_small_delta_t so volume added is constant.

#Flow, volume and concentration
Fi = m.Param(Fi)   #input feed-rate (L/h)
Fo = 0              #output feed-rate (L/h)
V = 3              #volume (L)
SG = 653           #glucose concentration in the feed (mM)
SQ = 58.8          #glutamine concentration in the feed (mM)


XTMM = m.Var(value=2,lb=-0.0000,name='XT')            #total cell density (MMcells/L)
XVMM = m.Var(value=2,lb=-0.0000, name='XV')      #viable cell density (MMcells/L)
XDMM = m.Var(value=0,lb=-0.0000,name='XD')          #dead cell density (MMcells/L)
G = m.Var(value = 20,lb=-0.0000,name='G')            #glucose concentration (mM)
Q = m.Var(value = 3.8,lb=-0.0000, name='Q')           #glutamine concentration (mM)
L = m.Var(value=0.1,lb=-0.0000,name='L')                #lactate concentration (mM)
A = m.Var(value=1.8,lb=-0.0000,name='A')              #ammonia concentration (mM)
Ci = m.Var(lb=-0.0000, name='Ci')            #inhibitor concentration (mM)
mu = m.Var(lb=-0.0000, name='mu')            #growth rate (1/h)
Kd = m.Var(lb=-0.0000, name='Kd')            #death rate(1/h)

# scale back to cells/L from million cells/L
XT = m.Intermediate(XTMM*1e8)
XV = m.Intermediate(XVMM*1e8)
XD = m.Intermediate(XDMM*1e8)

e1 = m.Intermediate((mu*XV - Klysis*XD - XT*Fo/V)/1e8)
e2 = m.Intermediate(((mu - Kd)*XV - XV*Fo/V)/1e8)
e3 = m.Intermediate((Kd*XV - Klysis*XD - XV*Fo/V)/1e8)
e4 = m.Intermediate((Fi/V)*SG - (Fo/V)*G + (-mu/YXG - mG)*XV)
e5 = m.Intermediate((Fi/V)*SQ - (Fo/V)*Q + (-mu/YXQ - mQ)*XV - KdQ*Q)
e6 = m.Intermediate(-YLG*(-mu/YXG -mG)*XV-(Fo/V)*L)
e7 = m.Intermediate(-YAQ*(-mu/YXQ - mQ)*XV +KdQ*Q-(Fo/V)*A)
e8 = m.Intermediate(qi*XV - (Fo/V)*Ci)
e9a = m.Intermediate((Ci_star*(KG+G)*(KQ+Q)*(L/KL + 1)*(A/KA + 1)))
e9b = m.Intermediate((mumax*G*Q*(Ci_star-Ci)))
e10a = m.Intermediate((mu+kmu))
e10b = m.Intermediate(Kdmax*kmu)

# create GEEKO equations
m.Equation(XTMM.dt() == e1)
m.Equation(XVMM.dt() == e2)
m.Equation(XDMM.dt() == e3)
m.Equation(G.dt() == e4)
m.Equation(Q.dt() == e5)
m.Equation(L.dt() == e6)
m.Equation(A.dt() == e7)
m.Equation(Ci.dt() == e8)
m.Equation(e9a * mu == e9b)
m.Equation(e10a * Kd == e10b)

# solve ODE
m.options.IMODE = 4
m.options.SOLVER = 1
m.options.NODES = 3
m.options.COLDSTART = 2
#m.open_folder()
m.solve(display=False)

plt.figure()
plt.subplot(3,1,1)
plt.plot(m.time, XV.value,label='XV')
plt.plot(m.time, XT.value,label='XT')
plt.plot(m.time, XD.value,label='XD')
plt.legend()
plt.subplot(3,1,2)
plt.plot(m.time, G.value,label='G')
plt.plot(m.time, Q.value,label='Q')
plt.plot(m.time, L.value,label='L')
plt.plot(m.time, A.value,label='A')
plt.plot(m.time, Ci.value,label='Ci')
plt.legend()
plt.subplot(3,1,3)
plt.plot(m.time, mu.value,label='mu')
plt.plot(m.time, Kd.value,label='Kd')
plt.legend()
plt.xlabel('Time (hr)')

plt.figure()
plt.plot(m.time, e1.value,'r-.',label='eqn1')
plt.plot(m.time, e2.value,'g:',label='eqn2')
plt.plot(m.time, e3.value,'b:',label='eqn3')
plt.plot(m.time, e4.value,'b--',label='eqn4')
plt.plot(m.time, e5.value,'y:',label='eqn5')
plt.plot(m.time, e6.value,'m--',label='eqn6')
plt.plot(m.time, e7.value,'b-.',label='eqn7')
plt.plot(m.time, e8.value,'g--',label='eqn8')
plt.plot(m.time, e9a.value,'r:',label='eqn9a')
plt.plot(m.time, e9b.value,'r--',label='eqn9b')
plt.plot(m.time, e10a.value,'k:',label='eqn10a')
plt.plot(m.time, e10b.value,'k--',label='eqn10b')
plt.legend()

plt.show()回答 1
Stack Overflow用户
发布于 2019-12-19 06:29:21
你的策略,把葡萄糖作为一个脉冲,是一个很好的方法,有一个间断的输入。葡萄糖浓度离散跳跃的问题是,有一个葡萄糖导数项作为方程4:m.Equation(G.dt() == e4)。如果dG/dt项在很短的时间内发生变化,那么导数项就会变得非常大。
一种在离散点处理大型导数的策略是利用m.options.NODES=2来避免有限元上附加正交配置的内节点问题。如果没有内部节点,您可能需要增加时间点的数量,以保持集成的准确性。这允许一个非常短的脉冲输入葡萄糖到间歇反应器,如3.6 seconds的加成。
feed_small_delta_t = 0.001 # 3.6 seconds
提要输入的索引为1,因此Fi[i+1]应该是应用脉冲的地方,而不是Fi[i]。
Fi = np.zeros(len(t))
for i in range(1,len(t)):
    if t[i]%(24) == 0:
        Fi[i+1] = 0.1/feed_small_delta_t
这给出了类似于以前的结果,但对于离散事件,即向批中添加额外的糖,输入的脉冲较短。

修改后的完整脚本
import numpy as np
from gekko import GEKKO
import matplotlib.pyplot as plt
import pandas as pd

m = GEKKO(remote=False)    # create GEKKO model

#constants 3L fed-batch
KdQ = 0.001        #degree of degradation of glutamine (1/h)
mG = 1.1e-10   #glucose maintenance coefficient (mmol/cell/hour)
YAQ = 0.90         #yield of ammonia from glutamine
YLG = 2            #yield of lactate from glucose
YXG = 2.2e8    #yield of cells from glucose (cells/mmol)
YXQ = 1.5e9    #yield of cells from glutamine (cells/mmol)
KL = 150           #lactate saturation constant (mM)
KA = 40            #ammonia saturation constant (mM)
Kdmax = 0.01       #maximum death rate (1/h)
mumax = 0.044      #maximum growth rate (1/h)
KG = 1             #glucose saturation constant (mM)
KQ = 0.22          #glutamine saturation constant (mM)
mQ = 0             #glutamine maintenance coefficient (mmol/cell/hour)
kmu = 0.01         #intrinsic death rate (1/h)
Klysis = 2e-2  #rate of cell lysis (1/h)
Ci_star = 100      #inhibitor saturation concentration (mM)
qi = 2.5e-10   #specific inhibitor production rate (1/h)

N_HOURS = 150 #Number of hours of the experiment
TIME_STEP = 0.5
feed_small_delta_t = 0.001

#create time array. It will be from 0 to N_HOURS, with time step TIME_STEP,
#and every 24h, there will be a feed_small_delta_t
t = []
for i in range(int(N_HOURS/TIME_STEP +1)):
    t_value = i*TIME_STEP
    t.append(t_value)

    if t_value%24 == 0:
        t.append(t_value + feed_small_delta_t)

m.time = t

#Create input feed-rate array
Fi = np.zeros(len(t))
for i in range(1,len(t)):
    if t[i]%(24) == 0:
        Fi[i+1] = 0.1/feed_small_delta_t #it is divided by feed_small_delta_t so volume added is constant.

#Flow, volume and concentration
Fi = m.Param(Fi)   #input feed-rate (L/h)
Fo = 0              #output feed-rate (L/h)
V = 3              #volume (L)
SG = 653           #glucose concentration in the feed (mM)
SQ = 58.8          #glutamine concentration in the feed (mM)


XTMM = m.Var(value=2,lb=-0.0000,name='XT')            #total cell density (MMcells/L)
XVMM = m.Var(value=2,lb=-0.0000, name='XV')      #viable cell density (MMcells/L)
XDMM = m.Var(value=0,lb=-0.0000,name='XD')          #dead cell density (MMcells/L)
G = m.Var(value = 20,lb=-0.0000,name='G')            #glucose concentration (mM)
Q = m.Var(value = 3.8,lb=-0.0000, name='Q')           #glutamine concentration (mM)
L = m.Var(value=0.1,lb=-0.0000,name='L')                #lactate concentration (mM)
A = m.Var(value=1.8,lb=-0.0000,name='A')              #ammonia concentration (mM)
Ci = m.Var(lb=-0.0000, name='Ci')            #inhibitor concentration (mM)
mu = m.Var(lb=-0.0000, name='mu')            #growth rate (1/h)
Kd = m.Var(lb=-0.0000, name='Kd')            #death rate(1/h)

# scale back to cells/L from million cells/L
XT = m.Intermediate(XTMM*1e8)
XV = m.Intermediate(XVMM*1e8)
XD = m.Intermediate(XDMM*1e8)

e1 = m.Intermediate((mu*XV - Klysis*XD - XT*Fo/V)/1e8)
e2 = m.Intermediate(((mu - Kd)*XV - XV*Fo/V)/1e8)
e3 = m.Intermediate((Kd*XV - Klysis*XD - XV*Fo/V)/1e8)
e4 = m.Intermediate((Fi/V)*SG - (Fo/V)*G + (-mu/YXG - mG)*XV)
e5 = m.Intermediate((Fi/V)*SQ - (Fo/V)*Q + (-mu/YXQ - mQ)*XV - KdQ*Q)
e6 = m.Intermediate(-YLG*(-mu/YXG -mG)*XV-(Fo/V)*L)
e7 = m.Intermediate(-YAQ*(-mu/YXQ - mQ)*XV +KdQ*Q-(Fo/V)*A)
e8 = m.Intermediate(qi*XV - (Fo/V)*Ci)
e9a = m.Intermediate((Ci_star*(KG+G)*(KQ+Q)*(L/KL + 1)*(A/KA + 1)))
e9b = m.Intermediate((mumax*G*Q*(Ci_star-Ci)))
e10a = m.Intermediate((mu+kmu))
e10b = m.Intermediate(Kdmax*kmu)

# create GEEKO equations
m.Equation(XTMM.dt() == e1)
m.Equation(XVMM.dt() == e2)
m.Equation(XDMM.dt() == e3)
m.Equation(G.dt() == e4)
m.Equation(Q.dt() == e5)
m.Equation(L.dt() == e6)
m.Equation(A.dt() == e7)
m.Equation(Ci.dt() == e8)
m.Equation(e9a * mu == e9b)
m.Equation(e10a * Kd == e10b)

# solve ODE
m.options.IMODE = 4
m.options.SOLVER = 1
m.options.NODES = 2
m.options.COLDSTART = 2
#m.open_folder()
m.solve(display=False)

plt.figure()
plt.subplot(3,1,1)
plt.plot(m.time, XV.value,label='XV')
plt.plot(m.time, XT.value,label='XT')
plt.plot(m.time, XD.value,label='XD')
plt.legend()
plt.subplot(3,1,2)
plt.plot(m.time, G.value,label='G')
plt.plot(m.time, Q.value,label='Q')
plt.plot(m.time, L.value,label='L')
plt.plot(m.time, A.value,label='A')
plt.plot(m.time, Ci.value,label='Ci')
plt.legend()
plt.subplot(3,1,3)
plt.plot(m.time, mu.value,label='mu')
plt.plot(m.time, Kd.value,label='Kd')
plt.legend()
plt.xlabel('Time (hr)')

plt.figure()
plt.plot(m.time, e1.value,'r-.',label='eqn1')
plt.plot(m.time, e2.value,'g:',label='eqn2')
plt.plot(m.time, e3.value,'b:',label='eqn3')
plt.plot(m.time, e4.value,'b--',label='eqn4')
plt.plot(m.time, e5.value,'y:',label='eqn5')
plt.plot(m.time, e6.value,'m--',label='eqn6')
plt.plot(m.time, e7.value,'b-.',label='eqn7')
plt.plot(m.time, e8.value,'g--',label='eqn8')
plt.plot(m.time, e9a.value,'r:',label='eqn9a')
plt.plot(m.time, e9b.value,'r--',label='eqn9b')
plt.plot(m.time, e10a.value,'k:',label='eqn10a')
plt.plot(m.time, e10b.value,'k--',label='eqn10b')
plt.legend()

plt.show()https://stackoverflow.com/questions/59399823
复制相似问题
腾讯云开发者

Copyright © 2013 - 2026 Tencent Cloud. All Rights Reserved. 腾讯云 版权所有
深圳市腾讯计算机系统有限公司 ICP备案/许可证号:粤B2-20090059 ![]() 粤公网安备44030502008569号
粤公网安备44030502008569号
腾讯云计算(北京)有限责任公司 京ICP证150476号 | 京ICP备11018762号