
最好的方法来制作一个黑色和白色格格图条形图与多个堆叠段在你的酒吧?
最好的方法来制作一个黑色和白色格格图条形图与多个堆叠段在你的酒吧?
提问于 2019-12-20 18:52:31
我正在尝试使用ggplot来为一个只有黑白打印的出版物制作条形图。我每个酒吧都有6个堆栈,所以使用scale_fill_grey()会使它看起来很奇怪,也很难读懂。有没有一种更好、更干净的方法来做这件事?
这是我的数据:
dput(head(Russets))
structure(list(Variety = structure(c(4L, 4L, 4L, 4L, 4L, 5L), .Label = c("Burbank 2018",
"Norkotah 2018", "Silverton 2018", "Burbank 2019", "Norkotah 2019",
"Silverton 2019"), class = "factor"), Rate = c("1", "2", "3",
"4", "5", "1"), Hollow = c("67", "65", "64", "63", "67", "73"
), Double = c("42", "43", "42", "43", "48", "56"), Knob = c("351",
"391", "362", "348", "357", "371"), AllCWT.AC = c("AVGCWT.AC.0.4",
"AVGCWT.AC.0.4", "AVGCWT.AC.0.4", "AVGCWT.AC.0.4", "AVGCWT.AC.0.4",
"AVGCWT.AC.0.4"), ValueCWT.AC = c(224.92342125, 226.91992125,
226.967565, 237.4482825, 227.80791, 168.32446125), TuberSize = structure(c(1L,
1L, 1L, 1L, 1L, 1L), .Label = c("0-4 oz", "4-6 oz", "6-10 oz",
"10-13 oz", "13+ oz", "Culls"), class = "factor")), row.names = c(NA,
6L), class = "data.frame")
下面是我当前的场景:
RussetPlot <-ggplot(data=Russets,aes(x=Rate,y=ValueCWT.AC,group=interaction(TuberSize,Variety),fill=(TuberSize))) +
  geom_col(position = "stack",inherit.aes = TRUE) +
  facet_wrap(~Variety,nrow=2) +
  scale_color_discrete(name = "Tuber Sizes", labels = c("0-4 oz", "4-6 oz", "6-10 oz", "10-13 oz", "13+ oz", "Culls"))


print(RussetPlot)
谢谢您的建议!
回答 2
Stack Overflow用户
发布于 2019-12-20 19:37:48
一个更手动的选项(以@dc37 37的答案为基础):
使用scale_fill_manual()
ggplot(df, aes(x = variable, y = number, fill = fact))+
    geom_col(color = "black)+
    theme_bw()+
    scale_fill_manual(values = c("grey10","grey30","grey50","grey70","grey80","grey90"))
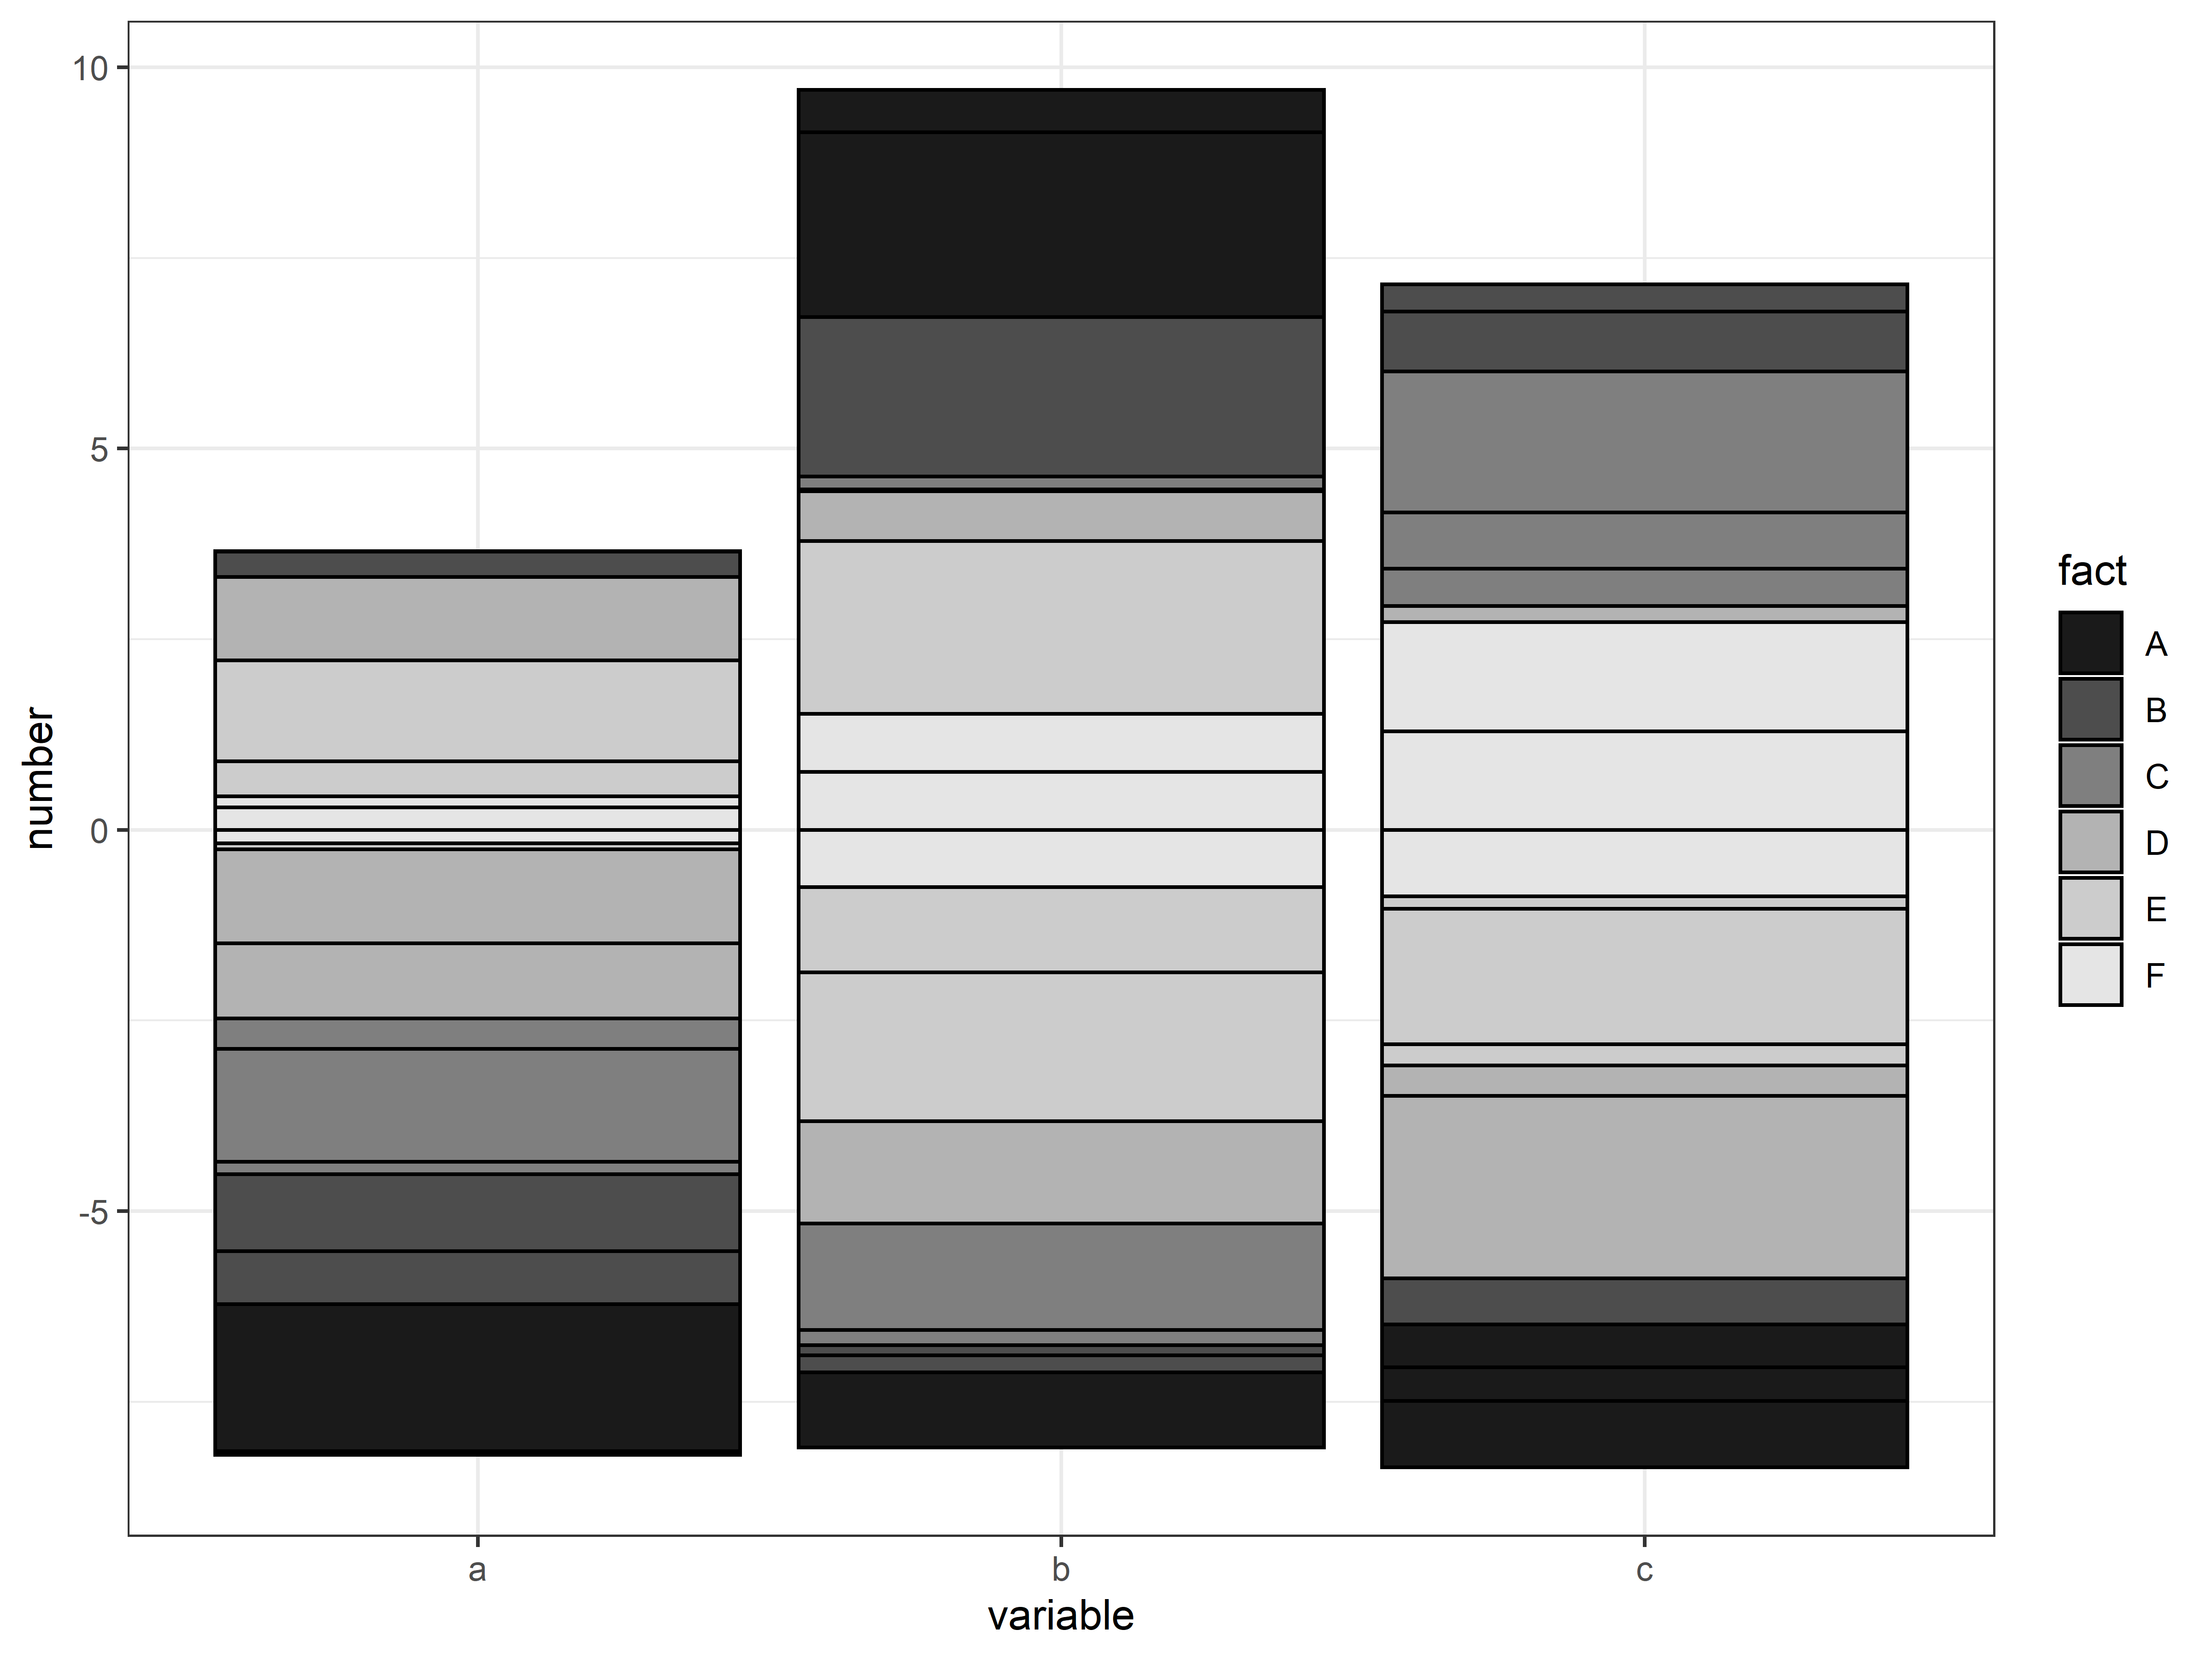
数据
fact = rep(LETTERS[1:6],9)
number = rnorm(54)
variable = c(rep("a",18),rep("b",18),rep("c",18))
df = data.frame(fact,number, variable)Stack Overflow用户
发布于 2019-12-20 19:31:13
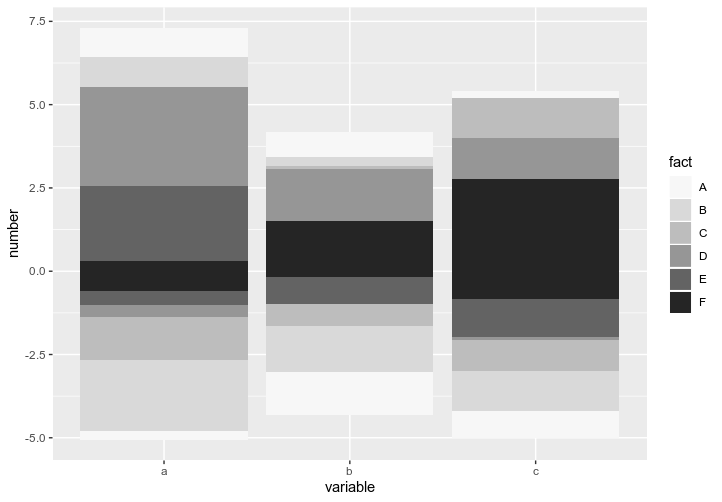
也许您可以尝试使用顺序调色板scale_fill_brewer Greys
(正如@TheSciGuy所指出的,您提供的示例没有重复6个不同的条件,因此它对尝试代码没有太大帮助)。
我创建了一个虚拟示例,并在这里说明了它的外观:
ggplot(df, aes(x = variable, y = number, fill = fact))+
  geom_col()+
  scale_fill_brewer(type = "seq", palette = "Greys")
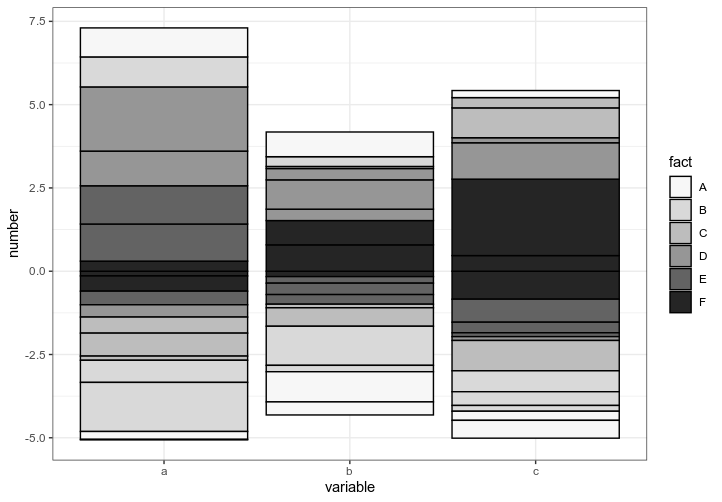
ggplot2黑白主题
library(ggplot2)
ggplot(df, aes(x = variable, y = number, fill = fact))+
  geom_col(color = "black")+
  scale_fill_brewer(type = "seq", palette = "Greys")+
  theme_bw()
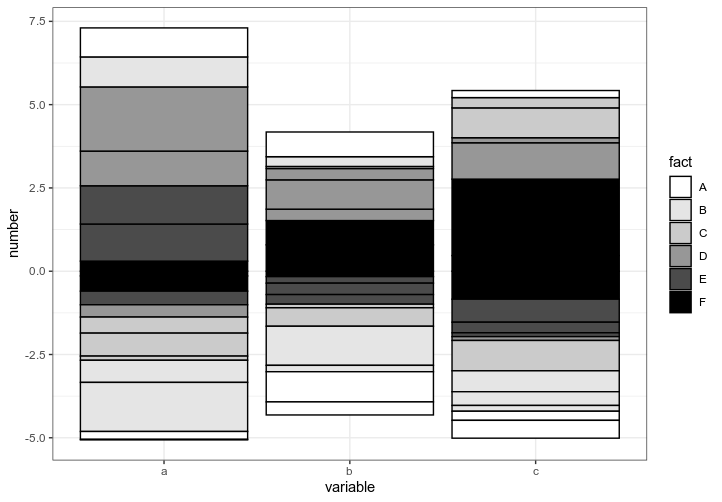
有了@TheSciGuy的回答,它提醒我您可以使用RColorBrewer库创建自己的调色板:
library(RColorBrewer)
col = colorRampPalette(c("white","grey","black"))(6)

library(ggplot2)
ggplot(df, aes(x = variable, y = number, fill = fact))+
  geom_col(color = "black")+
  scale_fill_manual(values = col) +
  theme_bw()
虚拟数据
fact = rep(LETTERS[1:6],9)
number = rnorm(54)
variable = c(rep("a",18),rep("b",18),rep("c",18))
df = data.frame(fact,number, variable)页面原文内容由Stack Overflow提供。腾讯云小微IT领域专用引擎提供翻译支持
原文链接:
https://stackoverflow.com/questions/59430088
复制相关文章
相似问题
腾讯云开发者

Copyright © 2013 - 2026 Tencent Cloud. All Rights Reserved. 腾讯云 版权所有
深圳市腾讯计算机系统有限公司 ICP备案/许可证号:粤B2-20090059 ![]() 粤公网安备44030502008569号
粤公网安备44030502008569号
腾讯云计算(北京)有限责任公司 京ICP证150476号 | 京ICP备11018762号