
Python可视化-直方图
以下两个问题是关于我正在试图构建的直方图。
(一)我希望这些回收箱如下:
[0-10,10-20,...,580-590, 590-600]. I tried the following code: bins_range=[]
for i in range(0,610,10):
bins_range.append(i)
plt.hist(df['something'], bins=bins_range, rwidth=0.95)我希望看到上面的回收箱与它们对应的每个垃圾桶的样本数量,但是我只得到了10个桶(作为默认参数)。
2)如何改变y轴:假设我的最大箱包含40个样本,所以我希望它不是y轴上的40个,而是100%,其他的也是一样。也就是说,30 %是75%,20是50%等等。
回答 1
Stack Overflow用户
发布于 2019-12-23 11:00:44
您的代码似乎运行良好。甚至可以将range命令直接传递给hist的bins参数。
要得到y轴的百分比,我认为您需要两次传递:首先,计算回收箱,以知道最高的回收箱包含了多少。然后,使用1/highest作为权重进行绘图。有一个numpy np.hist不需要绘图就可以完成所有的计算。
使用PercentFormatter()以百分比显示轴。它将获得一个参数,以判断100%代表多少。使用PercentFormatter(max(hist))获得最高值为100%。如果您只希望总数为100%,只需通过PercentFormatter(len(x)),而不需要计算直方图两次。由于y轴在内部仍在值中,因此滴答不会出现在所需的位置。您可以使用plt.yticks(np.linspace(0, max(hist), 11))为每10%的滴答。
为了获得更好的分隔之间的酒吧,您可以设置一个明确的边缘颜色。最好没有rwidth=0.95
示例代码:
import numpy as np
import matplotlib.pyplot as plt
from matplotlib.ticker import PercentFormatter

x = np.random.rayleigh(200, 50000)
hist, bins = np.histogram(x, bins=range(0, 610, 10))
plt.hist(x, bins=bins, ec='white', fc='darkorange')
plt.gca().yaxis.set_major_formatter(PercentFormatter(max(hist)))
plt.yticks(np.linspace(0, max(hist), 11))

plt.show()
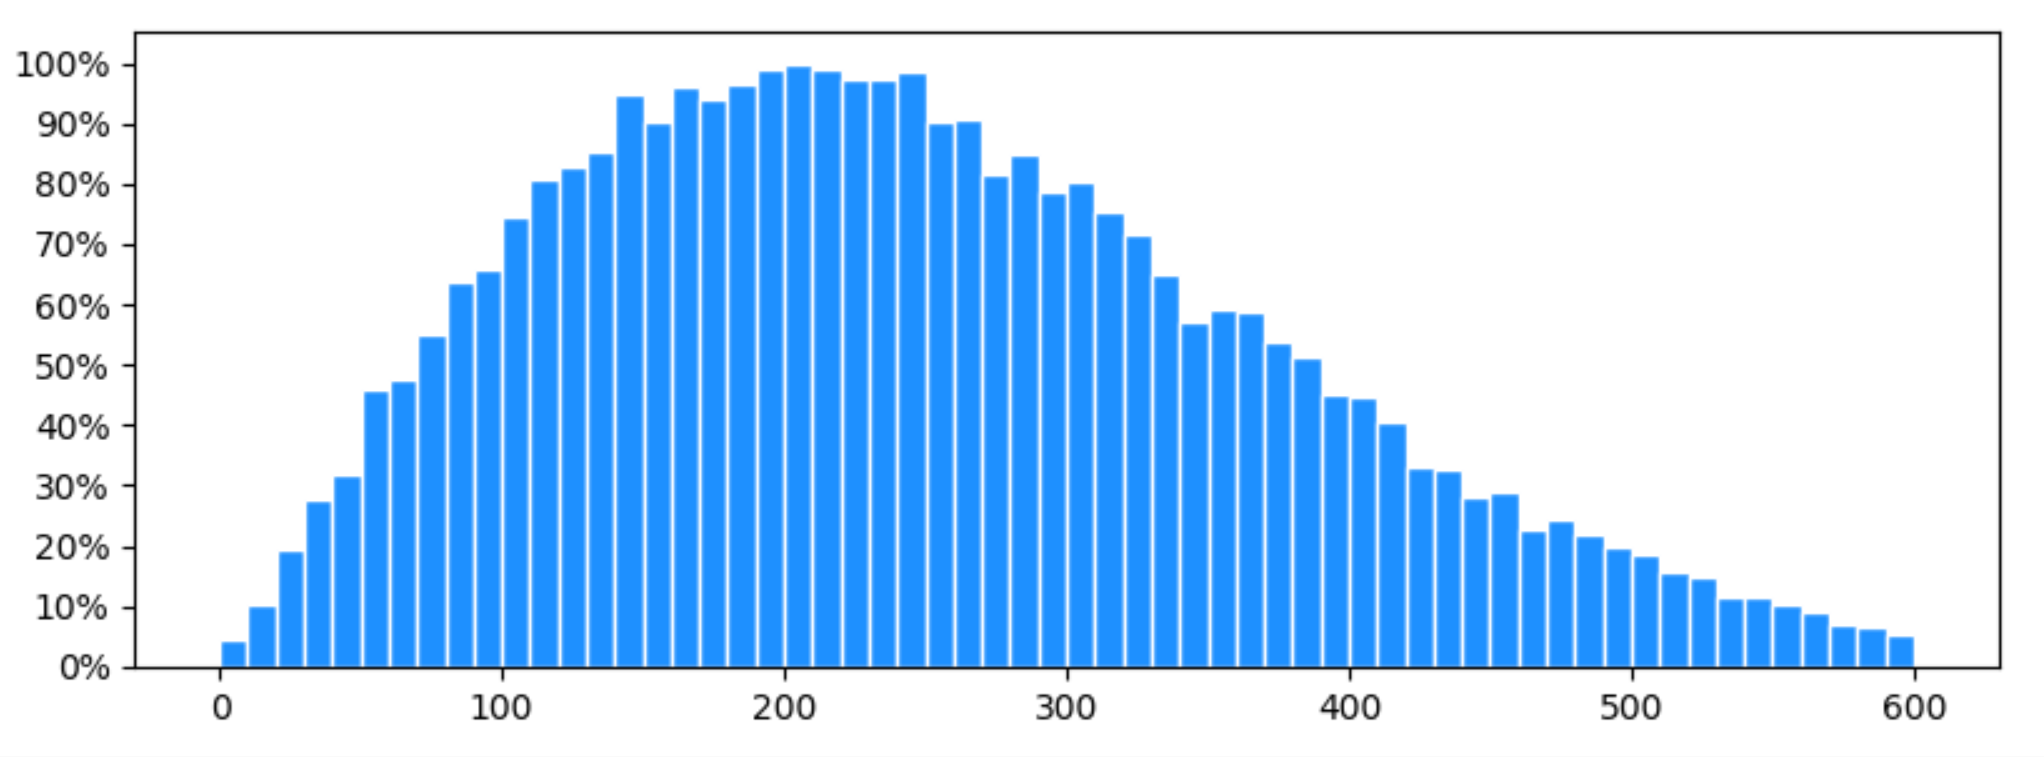
PS:要使用matplotlib的标准yticks,并在内部以百分比表示y轴,可以使用hist的hist参数。当您想要交互地调整绘图的大小或缩放,或者需要以特定百分比的水平线时,这是非常方便的。
plt.hist(x, bins=bins, ec='white', fc='dodgerblue', weights=np.ones_like(x)/max(hist))
plt.gca().yaxis.set_major_formatter(PercentFormatter(1))https://stackoverflow.com/questions/59453159
复制相似问题
腾讯云开发者

Copyright © 2013 - 2026 Tencent Cloud. All Rights Reserved. 腾讯云 版权所有
深圳市腾讯计算机系统有限公司 ICP备案/许可证号:粤B2-20090059 ![]() 粤公网安备44030502008569号
粤公网安备44030502008569号
腾讯云计算(北京)有限责任公司 京ICP证150476号 | 京ICP备11018762号