
为什么Holoviz面板显示文本而不是海运图?
为什么Holoviz面板显示文本而不是海运图?
提问于 2020-01-06 10:33:31
我想在木星笔记本中创建一个Holoviz小组仪表板,其中包含一个海上条形图。我可以让仪表板成功地显示matplotlib图,但是海运图没有显示--只是一些文本(AxesSubplot(0.125,0.125;0.775x0.755))。
我在Holoviz网站上看过一些例子,并搜索了海运的具体例子,但找不到任何例子。我还搜索了StackOverflow和Google,没有发现任何能显示如何成功显示海上地图的东西。
我的代码:
import pandas as pd
import numpy as np
import matplotlib.pyplot as plt
import seaborn as sns
import panel as pn
import hvplot as hv
# create a data set of animal ratings
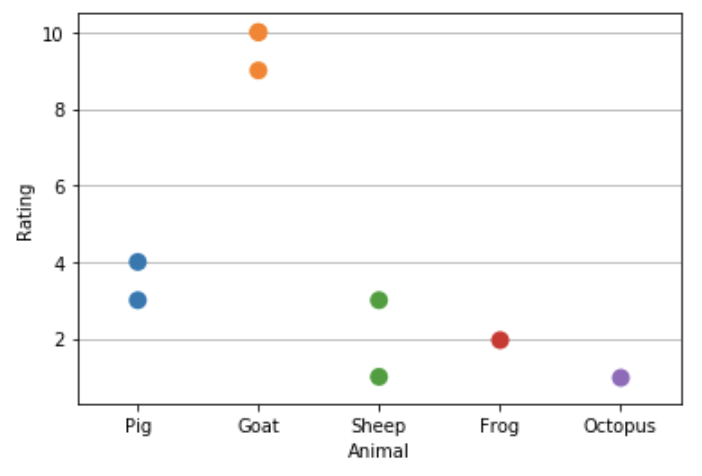
df = pd.DataFrame({'Animal':['Pig', 'Goat' ,'Sheep', 'Frog', 'Goat', 'Goat', 'Pig', 'Sheep', 'Octopus'],
'Rating':[3, 10, 3, 2, 9, 10, 4, 1, 1]})
# define the holoviz panel parameter selector and plots in a class
class RatingsDashboard(param.Parameterized):
# widget containing the list of animals
Animal = param.ObjectSelector(default='Goat', objects=list(df.Animal.unique()))
title = 'Ratings for '
xlabel = 'Rating'
ylim = (0, 3)
def get_data(self):
class_df = df[(df.Animal==self.Animal)].copy()
return class_df
def hist_view_all(self):
plot = plt.figure()
plot.add_subplot(111).hist(df['Rating'])
plt.close(plot)
return plot
# seaborn strip plot for all ratings for all animals
def strip_view_all(self):
plot = sns.stripplot(data = df, x='Animal', y='Rating', jitter=False, size=10)
return plot
def hist_view(self):
data = self.get_data()
title = "Histogram: " + self.title
plot = plt.figure()
plot.add_subplot(111).hist(data['Rating'])
plt.title('Histogram of ' + self.title + self.Animal, size=14)
plt.xlabel(self.xlabel, size=14)
plt.xticks(size=12)
plt.yticks(size=12)
plt.ylim(self.ylim)
plt.close(plot)
return plot
def table_view(self):
data = self.get_data()
return data
# create an instance of the class
rd = RatingsDashboard(name='')
# define the dashboard elements using a subset of the rd class plots
dashboard3 = pn.Column('## Animal Ratings', rd.strip_view_all, rd.param,
pn.Row(rd.hist_view, rd.table_view))
# display the dashboard
dashboard3输出:
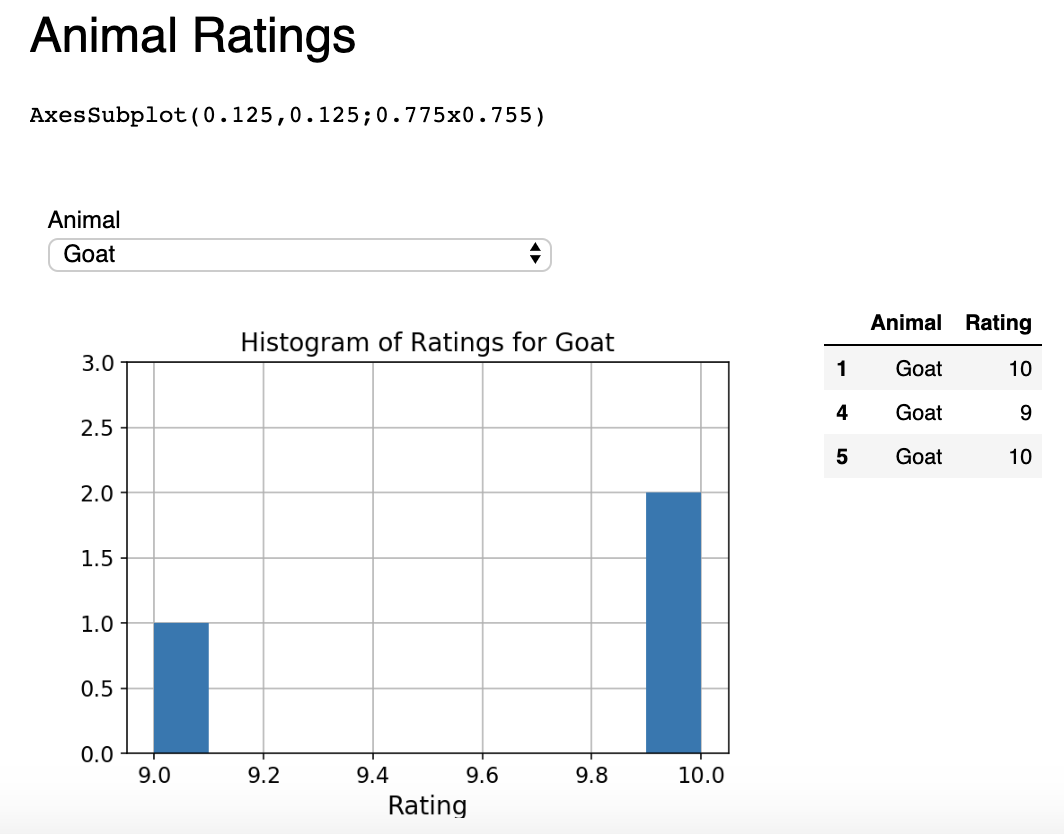
应显示的Seaborn条形图输出,而不是文本:
回答 1
Stack Overflow用户
回答已采纳
发布于 2020-01-06 11:05:12
感谢用户ImportanceOfBeingErnest的回答:
hist_view_all返回一个图形,而strip_view_all返回一个轴。根据变量包含的内容,最好的名称为ax =sns.stripplot(.),然后返回图,返回ax.figure
页面原文内容由Stack Overflow提供。腾讯云小微IT领域专用引擎提供翻译支持
原文链接:
https://stackoverflow.com/questions/59610517
复制相关文章
相似问题
腾讯云开发者

Copyright © 2013 - 2026 Tencent Cloud. All Rights Reserved. 腾讯云 版权所有
深圳市腾讯计算机系统有限公司 ICP备案/许可证号:粤B2-20090059 ![]() 粤公网安备44030502008569号
粤公网安备44030502008569号
腾讯云计算(北京)有限责任公司 京ICP证150476号 | 京ICP备11018762号