
无法从“bokeh.plotting”导入名称“分散”
我试图用bokeh散射来表示数据。这是我的代码:
从bokeh.plotting进口散射图,output_file显示进口熊猫df=pandas.Dataframe(colume"X","Y") df"X"=1,2,3,4,5,6,7 df"Y"=23,43,32,12,34,54,33 p=Scatter(df,x="X",y="Y",title=“日温度测量”,xlabel=“温度”,ylabel="Day") output_file("File.html")显示(P)
输出应该如下所示:预期产出
错误是:
ImportError                               Traceback (most recent call
> last) <ipython-input-14-1730ac6ad003> in <module>
> ----> 1 from bokeh.plotting import Scatter, output_file, show
>       2 import pandas
>       3
>       4 df=pandas.Dataframe(colume["X","Y"])
>       5
(C:\Users\LENOVO\Anaconda3\lib\site-packages\bokeh\plotting__init__.py) ImportError:无法从“bokeh.plotting”bokeh.plotting导入名称“分散”
我还发现,散落现在已不再维持。有什么办法可以用吗?另外,我还必须使用任何其他python库来表示数据和分散数据吗?
使用旧版本的Bokeh会解决这个问题吗?
回答 2
Stack Overflow用户
发布于 2020-01-09 19:43:42
Scatter (以S为大写)从未成为bokeh.plotting的一部分。它曾经是几年前被删除的旧bokeh.charts API的一部分。但是,根本不需要创建基本散点图,因为bokeh.plotting中的所有字形方法(例如circle、square)都是隐式散乱类型函数:
from bokeh.plotting import figure, show
import pandas as pd
df = pd.DataFrame({"X" :[1,2,3,4,5,6,7],
"Y": [23,43,32,12,34,54,33]})
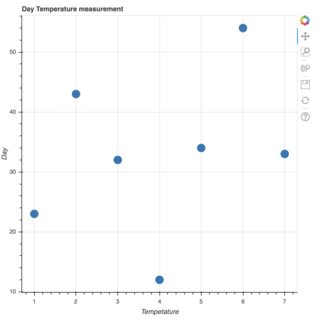
p = figure(x_axis_label="Tempetature", y_axis_label="Day",
title="Day Temperature measurement")
p.circle("X", "Y", size=15, source=df)
show(p)产生的结果:
您还可以将数据直接以在另一个答案中的形式传递给在另一个答案中。
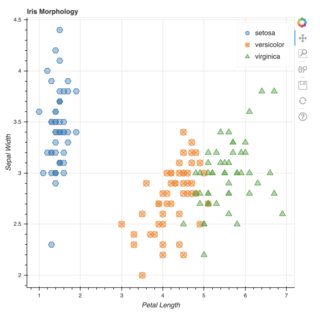
如果您想做一些更好的事情,比如基于列映射标记类型,那么图中还有一个plot.scatter (小写s)方法:
from bokeh.plotting import figure, show
from bokeh.sampledata.iris import flowers
from bokeh.transform import factor_cmap, factor_mark

SPECIES = ['setosa', 'versicolor', 'virginica']
MARKERS = ['hex', 'circle_x', 'triangle']

p = figure(title = "Iris Morphology")
p.xaxis.axis_label = 'Petal Length'
p.yaxis.axis_label = 'Sepal Width'

p.scatter("petal_length", "sepal_width", source=flowers, legend_field="species", fill_alpha=0.4, size=12,
          marker=factor_mark('species', MARKERS, SPECIES),
          color=factor_cmap('species', 'Category10_3', SPECIES))

show(p)
产生的结果:
Stack Overflow用户
发布于 2020-01-09 19:42:27
如果你在文档中查找“分散”,你会发现
散射标记 若要在绘图中散布圆圈标记,请使用图的
circle()方法: 从bokeh.plotting导入图形output_file,显示#输出到静态HTML文件output_file("line.html") p=图(plot_width=400,plot_height=400) #添加一个具有大小、颜色和αp.circle(1、2、3、4、5、6、7、2、4、5、size=20、color=“海军”、alpha=0.5) #显示结果(P)
要处理数据格式,只需将df.X和df.Y这样的列传递给x和y args即可。
from bokeh.plotting import figure, show, output_file
import pandas as pd

df = pd.DataFrame(columns=["X","Y"])

df["X"] = [1,2,3,4,5,6,7]
df["Y"] = [23,43,32,12,34,54,33]

p = figure()
p.scatter(df.X, df.Y, marker="circle")

#from bokeh.io import output_notebook
#output_notebook()

show(p) # or output to a file...https://stackoverflow.com/questions/59670727
复制相似问题
腾讯云开发者

Copyright © 2013 - 2026 Tencent Cloud. All Rights Reserved. 腾讯云 版权所有
深圳市腾讯计算机系统有限公司 ICP备案/许可证号:粤B2-20090059 ![]() 粤公网安备44030502008569号
粤公网安备44030502008569号
腾讯云计算(北京)有限责任公司 京ICP证150476号 | 京ICP备11018762号