
用hvplot/holoview更改分组条形图中的条形图的顺序
我试图创建一个分组条形图,但不知道如何影响条形图的顺序。
鉴于这些示例数据:
import pandas as pd
import hvplot.pandas

df = pd.DataFrame({
    "lu": [200, 100, 10],
    "le": [220, 80, 130],
    "la": [60, 20, 15],
    "group": [1, 2, 2],
})
df = df.groupby("group").sum()
我想要创建一个水平分组条形图,显示两个组1和2的所有三列。列应按"le“、"la”和"lu“的顺序排列。
很自然,我会用Hvplot试试这个:
df.hvplot.barh(x = "group", y = ["le", "la", "lu"])这样,我得到的结果如下:
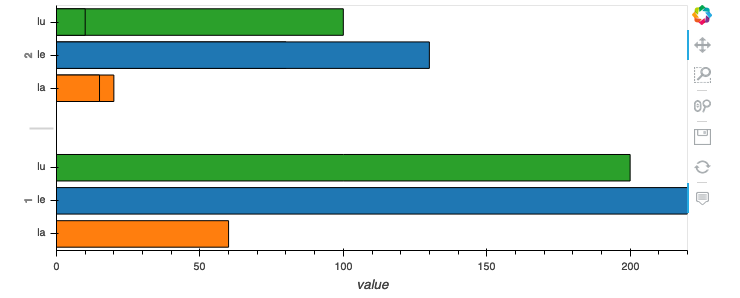
Hvplot似乎并不关心我添加列的顺序(调用df.hvplot.barh(x = "group", y = ["lu", "le", "la"])不会改变任何事情)。Hvplot似乎也不关心dataframe中的原始顺序。
有什么选择可以影响酒吧的秩序吗?
回答 2
Stack Overflow用户
发布于 2020-01-15 21:57:34
刚刚在HoloViews 1.13中修正了这个问题。
你可以像你想的那样整理你的酒馆:
df.hvplot.barh(x="group", y=["lu", "la", "le"])在我编写这篇文章时,HoloViews 1.13还没有正式可用,但是您可以通过以下方法安装它:
如果您想要更多地控制订单,可以在您的grouped_barplot:上使用.redim.values()
group_specific_order = [2, 1]
variable_specific_order = ['lu', 'la', 'le']

# Note that group and Variable are the variable names of your dimensions here
# when you use this on a different grouped barchart, then please change to the
# names of your own dimensions.
your_grouped_barplot.redim.values(
    group=group_specific_order,
    Variable=variable_specific_order,
)Stack Overflow用户
发布于 2020-01-14 20:03:02
对于普通条形图,您只需按您希望绘制的方式对数据进行排序。
但是,对于分组条形图,您还不能设置顺序。。
但是这个特性的开发正在进行中,可能可以在下一个版本中获得:https://github.com/holoviz/holoviews/issues/3799。
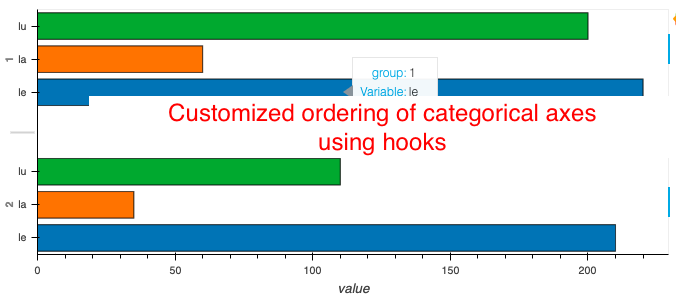
当前解决方案与Hvplot0.5.2和Holoview1.12:
1)如果您使用的是Bokeh后端,您可以使用关键字hooks
from itertools import product

# define hook function to set order on bokeh plot
def set_grouped_barplot_order(plot, element):
    # define you categorical ordering in a list of tuples
    factors = product(['2', '1'], ['le', 'la', 'lu'])

    # since you're using horizontal bar set order on y_range.factors
    # if you would have had a normal (vertical) barplot you would use x_range.factors
    plot.state.y_range.factors = [*factors]

# create plot
group = df.groupby("group").sum()
group_plot = group.hvplot.barh(
    x="group",
    y=["le", "la", "lu"],
    padding=0.05,
)

# apply your special ordering function
group_plot.opts(hooks=[set_grouped_barplot_order], backend='bokeh')
钩子允许您应用特定的bokeh设置到您的情节。您并不经常需要钩子,但在这种情况下它们非常方便。文档:
http://holoviews.org/user_guide/Customizing_Plots.html#Plot-hooks
https://holoviews.org/FAQ.html
2) 另一种解决方案是将您的全息视图图转换为实际的Bokeh图,然后设置顺序:
from itertools import product
import holoviews as hv
from bokeh.plotting import show

# create plot
group = df.groupby("group").sum()
group_plot = group.hvplot.barh(
    x="group",
    y=["le", "la", "lu"],
    padding=0.05,
)

# render your holoviews plot as a bokeh plot
my_bokeh_plot = hv.render(group_plot, backend='bokeh')

# set the custom ordering on your bokeh plot
factors = product(['2', '1'], ['le', 'la', 'lu'])
my_bokeh_plot.y_range.factors = [*factors]

show(my_bokeh_plot)
就我个人而言,我更喜欢第一个解决方案,因为它停留在全息视图中。
结果图:
https://stackoverflow.com/questions/59735494
复制相似问题
腾讯云开发者

Copyright © 2013 - 2026 Tencent Cloud. All Rights Reserved. 腾讯云 版权所有
深圳市腾讯计算机系统有限公司 ICP备案/许可证号:粤B2-20090059 ![]() 粤公网安备44030502008569号
粤公网安备44030502008569号
腾讯云计算(北京)有限责任公司 京ICP证150476号 | 京ICP备11018762号