
Gnu图5:曲线之间的彩色渐变阴影
Gnu图5:曲线之间的彩色渐变阴影
提问于 2020-02-10 12:56:36
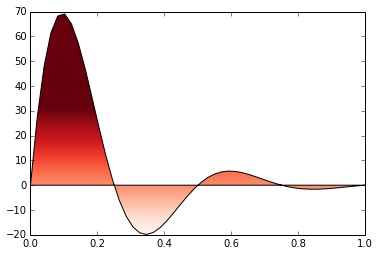
这是使用Matplotlib创建的。是否有可能在gnuket5中做出相同类型的阴影?
回答 1
Stack Overflow用户
回答已采纳
发布于 2020-02-10 21:03:12
我不知道gnu图有渐变填充选项,但我可能错了。以下是一个“丑陋”的解决办法。基本上,你在彼此之上创建了3个地块。您可能需要调整调色板以获得所需的颜色和平稳过渡。
以调色板为背景(即与图形一样大的彩色盒)的虚拟图形,x1-axis.
- plot
- 覆盖了
y>f(x)和y>0到x2-axis的部分,以及y<f(x)和y<0以下的y<f(x)和y<0再次显示f(x)以查看f(x)和轴tics再次H 214G 215
编辑:,早期版本的代码使用multiplot。没有必要,只需使用set colorbox back即可。但是set xzeroaxis ls -1不再是可见的,而是添加plot 0 w l ls -1。
代码:
### filled curve with gradient
reset session
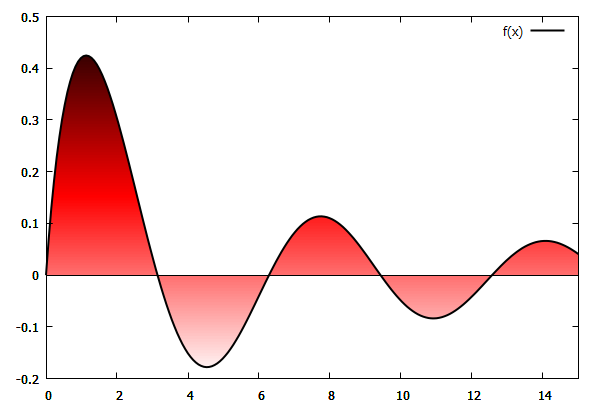
f(x) = sin(x)/(1+x)
fabove(x) = f(x)<0 ? 0 : f(x)
fbelow(x) = f(x)>0 ? 0 : f(x)
set samples 200
set palette defined (0 "white", 1 "red", 2 "black")
set colorbox back user origin graph 0, graph 0 size graph 1, graph 1
unset cbtics
set xrange[0:15]
set xzeroaxis ls -1
set yrange[-0.2:0.5]
plot fabove(x) w filledcurves x2 fc rgb "white" not, \
fbelow(x) w filledcurves x1 fc rgb "white" not, \
f(x) w l lw 2 lc rgb "black", \
NaN palette, \
0 w l ls -1
### end of code结果:
页面原文内容由Stack Overflow提供。腾讯云小微IT领域专用引擎提供翻译支持
原文链接:
https://stackoverflow.com/questions/60150912
复制相关文章
相似问题
腾讯云开发者

Copyright © 2013 - 2026 Tencent Cloud. All Rights Reserved. 腾讯云 版权所有
深圳市腾讯计算机系统有限公司 ICP备案/许可证号:粤B2-20090059 ![]() 粤公网安备44030502008569号
粤公网安备44030502008569号
腾讯云计算(北京)有限责任公司 京ICP证150476号 | 京ICP备11018762号