
向图中添加回归线
向图中添加回归线
提问于 2020-02-11 17:26:42
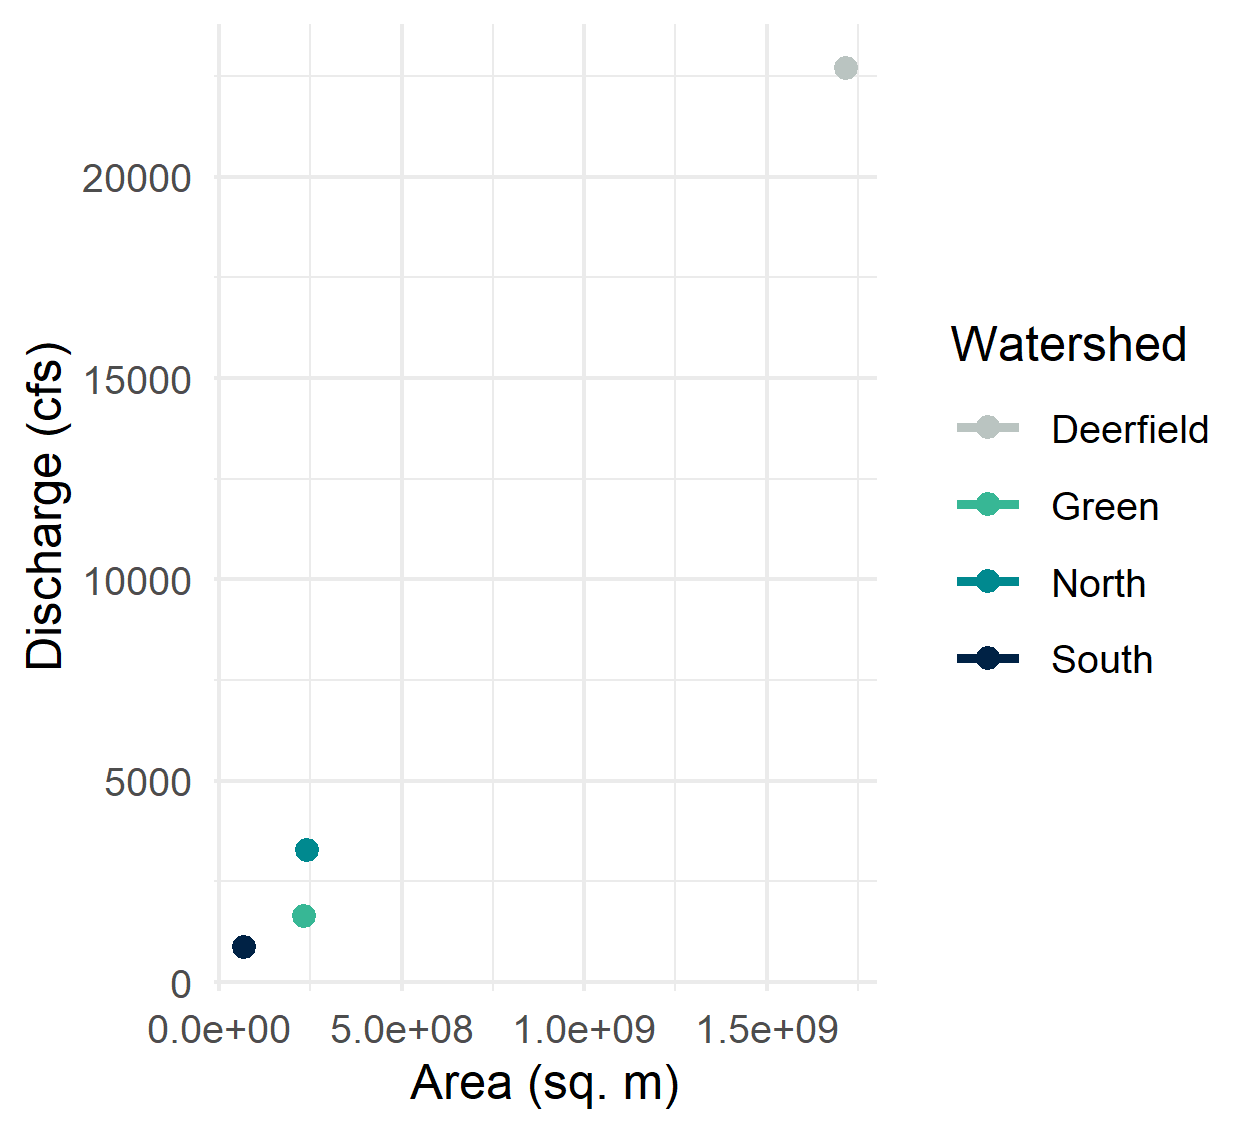
我正试图在我的绘图中添加一个线性回归模型。我有一个数据框架:
           watershed        sqm        cfs
3 deerfieldwatershed 1718617392 22703.8851
5     greenwatershed  233458430  1637.4895
6     northwatershed  240348182  3281.9921
8     southwatershed   68031782   867.6428
我现在的代码是:
ggplot(dischargevsarea, aes(x = sqm, y = cfs, color = watershed)) +
  geom_point(aes(color = watershed), size = 2) +
  labs(y= "Discharge (cfs)", x = "Area (sq. m)", color = "Watershed") +
  scale_color_manual(values = c("#BAC4C1", "#37B795",
                                "#00898F", "#002245"),
                     labels = c("Deerfield", "Green", "North",
                                "South")) +
  theme_minimal() +
  geom_smooth(method = "lm", se = FALSE)
它在运行时向图例中的点添加一行,但没有显示在图表上(见下图)。我怀疑这是为每个点分别画了一条线,但我想对所有四个点都画一条回归线。我怎么才能得到我想要出现的线路?谢谢。
回答 1
Stack Overflow用户
回答已采纳
发布于 2020-02-11 17:30:59
是的,这是因为您的点被分组在不同的类别中(因为您的第一个aes中的aes),所以当您调用geom_smooth时,它将为每个类别建立一条回归线,在您的示例中,它意味着每个点。所以,这就是为什么你没有一条回归线。
要获得所有点的回归线,您可以只在color的aes of geom_point中传递geom_point参数(或者可以使用geom_smooth中的inherit.aes = FALSE向ggplot指示不考虑以前的映射参数并用新的参数填充它)。
要在图形上显示方程(基于注释中的问题),您可以使用ggpmisc包中的ggpmisc函数(在这里有一篇文章描述了它的使用:Add regression line equation and R^2 on graph):
library(ggplot2)
library(ggpmisc)
ggplot(df, aes(x = sqm, y = cfs)) +
  labs(y= "Discharge (cfs)", x = "Area (sq. m)", color = "Watershed") +
  scale_color_manual(values = c("#BAC4C1", "#37B795",
                                "#00898F", "#002245"),
                     labels = c("Deerfield", "Green", "North",
                                "South")) +
  theme_minimal() +
  geom_smooth(method = "lm", se = FALSE, formula = y~x)+
  stat_poly_eq(formula = y~x, aes(label = paste(..eq.label.., ..rr.label.., sep = "~~~")),
               parse = TRUE)+
  geom_point(aes(color = watershed))
数据
structure(list(watershed = c("deerfieldwatershed", "greenwatershed",
"northwatershed", "southwatershed"), sqm = c(1718617392L, 233458430L,
240348182L, 68031782L), cfs = c(22703.8851, 1637.4895, 3281.9921,
867.6428)), row.names = c(NA, -4L), class = c("data.table", "data.frame"
), .internal.selfref = <pointer: 0x55ef09764350>)页面原文内容由Stack Overflow提供。腾讯云小微IT领域专用引擎提供翻译支持
原文链接:
https://stackoverflow.com/questions/60174372
复制相关文章
相似问题
腾讯云开发者

Copyright © 2013 - 2026 Tencent Cloud. All Rights Reserved. 腾讯云 版权所有
深圳市腾讯计算机系统有限公司 ICP备案/许可证号:粤B2-20090059 ![]() 粤公网安备44030502008569号
粤公网安备44030502008569号
腾讯云计算(北京)有限责任公司 京ICP证150476号 | 京ICP备11018762号