
从距离矩阵创建系统发育树(Newick文件)?
从距离矩阵创建系统发育树(Newick文件)?
提问于 2020-02-12 11:00:45
我已经建立了我的基因簇,并且已经计算了测量它们之间的系统发育关系所需的距离。我使用了一种算法,基本上给出了基因簇之间距离的度量,并用数据表示,如(输入示例):
BGC1      BGC2     Distance
------------------------------
BGC31     BGC34     0.6
BGC34     BGC45     0.7
BGC34     BGC53     0.2
BGC53     BGC31     0.8

x <- data.frame(BGC1 = c('BGC31','BGC34','BGC34','BGC35'),
                BGC2 = c('BGC34','BGC45','BGC53','BGC51'),
distance = c(0.6,0.7,0.2,0.8))目标:是否有可能仅仅基于这种类型的数据构建一棵树?我也希望有一个可用的.newick文件,但我不确定是否可以使用R。
但是,我已经能够通过Cytoscape从这些数据创建网络可视化,但不可能是一棵树。对于这个特别的例子,还有什么进一步的建议吗?
再次感谢您的投入:)
回答 1
Stack Overflow用户
回答已采纳
发布于 2020-02-13 09:01:01
按照user20650 here的注释中的建议,您可以定义如何使用lower.tri函数包装到dist对象的距离。但是,所提供的示例不起作用,因为它不能提供样本之间的成对距离。因此,该解决方案获取示例名称,生成随机数据,然后从nj包构造带有ape函数的树。
# get all sample names
x.names = unique(c(levels(x[, 1]), levels(x[, 2])))
n = length(x.names)

# create all combinations for samples for pairwise comparisons
x2 = data.frame(t(combn(x.names, m = 2)))
# generate random distances
set.seed(4653)
x2$distance = sample(seq(from = 0.1, to = 1, by = 0.05), size = nrow(x2), replace = TRUE)

# prepare a matrix for pairwise distances
dst = matrix(NA, ncol = n, nrow = n, dimnames = list(x.names, x.names))
# fill the lower triangle with the distances obtained elsewhere
dst[lower.tri(dst)] = x2$distance

# construct a phylogenetic tree with the neighbour-joining method
library(ape)
tr = nj(dst)
plot(tr)
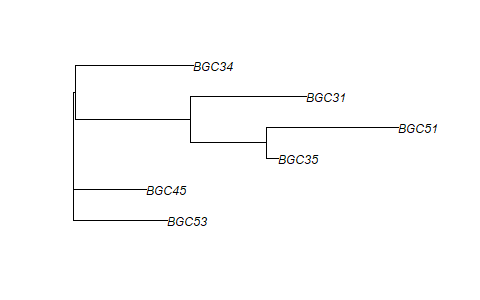
树的newick格式可以用ape::write.tree函数保存,也可以打印到控制台,如下所示:
cat(write.tree(tr))
# (BGC53:0.196875,BGC45:0.153125,(((BGC35:0.025,BGC51:0.275):0.1583333333,BGC31:0.2416666667):0.240625,BGC34:0.246875):0.003125);页面原文内容由Stack Overflow提供。腾讯云小微IT领域专用引擎提供翻译支持
原文链接:
https://stackoverflow.com/questions/60186834
复制相关文章
相似问题
腾讯云开发者

Copyright © 2013 - 2026 Tencent Cloud. All Rights Reserved. 腾讯云 版权所有
深圳市腾讯计算机系统有限公司 ICP备案/许可证号:粤B2-20090059 ![]() 粤公网安备44030502008569号
粤公网安备44030502008569号
腾讯云计算(北京)有限责任公司 京ICP证150476号 | 京ICP备11018762号