
试图创建一个标高地图,在R中
试图创建一个标高地图,在R中
提问于 2020-02-17 10:20:48
我对使用R非常陌生,我目前正在尝试使用以下代码创建一个研究站点的高程图:
library(rnaturalearth)
library(rnaturalearthhires)
library(mapview)
library(mapedit)
library(elevatr)
library(tidyverse)
library(raster)

countries<-ne_countries(scale = 110, type = "countries", continent = NULL,
                        country = NULL, geounit = NULL, sovereignty = NULL,
                        returnclass = c("sf"))

admin<-ne_states(country = NULL, geounit = NULL, iso_a2 = NULL, spdf = NULL,
                 returnclass = c("sf"))

admin %>% filter(name=="Áncash") -> Áncash
countries %>% filter(name=="Peru") -> PER

mapview(Áncash) %>% editMap() -> d

poly<-d$drawn
elev1 <- get_elev_raster(poly, z = 14,clip="bbox")
当我尝试运行它时,我会遇到以下错误消息:
Listening on http://my IP:8888 # For reasons I am not releasing my IP
createTcpServer: address not available
Error in .subset2(public_bind_env, "initialize")(...) :
  Failed to create server
>
> poly<-d$drawn
Error: object 'd' not found
> elev1 <- get_elev_raster(poly, z = 14,clip="bbox")
Error in if (attributes(class(locations)) %in% c("raster", "sp")) { :
  argument is of length zero
我可能错过了一些很简单的事情,但经过几个小时的努力,我现在需要帮助了!
提前感谢!
回答 1
Stack Overflow用户
回答已采纳
发布于 2020-02-17 12:19:15
当我下载了运行它所需的所有R包之后,您的代码实际上对我有效(最终):
library(rnaturalearth)
library(rnaturalearthhires)
library(mapview)
library(mapedit)
library(elevatr)
library(tidyverse)
library(raster)在运行editMap时,您似乎收到了一个错误,它启动了一个闪亮的应用程序,允许您在地图上绘制线条和多边形。你的问题中没有你的IP地址,但是这个IP地址应该是你的家庭地址,也就是http://127.0.0.1。
我认为您可能只需要更改正在运行的端口,所以请尝试如下:
options(shiny.port = 7775)当你这么做的时候
mapview(Áncash) %>% editMap() -> d它应该说
#> Listening on http://127.0.0.1:7775你的观众应该展示如下:
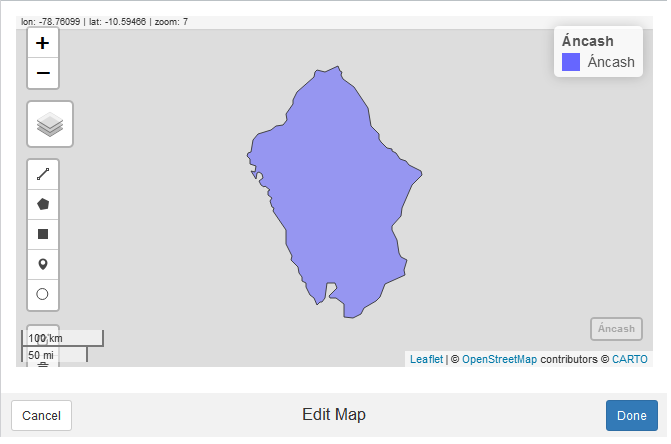
然后你应该能够在你的地图上画一个多边形。我建议您只绘制一个很小的多边形,否则高程数据将需要小时下载。
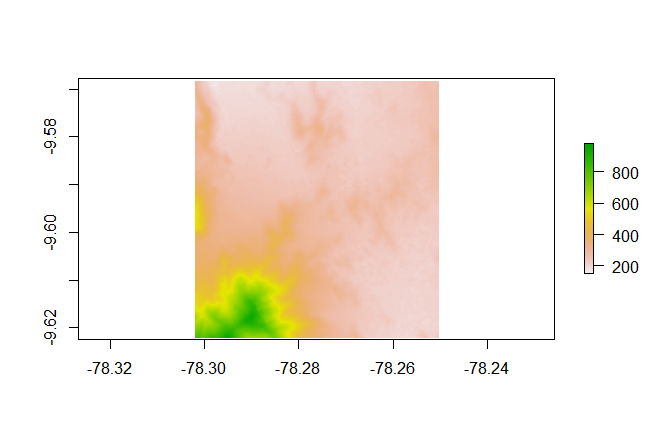
当您对多边形满意时,停止应用程序,d将包含您的多边形。所以现在当你
poly<-d$drawn
elev1 <- get_elev_raster(poly, z = 14, clip="bbox")数据将下载到栅格elev1,您现在可以绘制它:
plot(elev1)
页面原文内容由Stack Overflow提供。腾讯云小微IT领域专用引擎提供翻译支持
原文链接:
https://stackoverflow.com/questions/60260306
复制相关文章
相似问题
腾讯云开发者

Copyright © 2013 - 2026 Tencent Cloud. All Rights Reserved. 腾讯云 版权所有
深圳市腾讯计算机系统有限公司 ICP备案/许可证号:粤B2-20090059 ![]() 粤公网安备44030502008569号
粤公网安备44030502008569号
腾讯云计算(北京)有限责任公司 京ICP证150476号 | 京ICP备11018762号