
如何使用R中的ggplot2对节点/geom_point进行基于大小的梯度着色?
如何使用R中的ggplot2对节点/geom_point进行基于大小的梯度着色?
提问于 2020-02-20 01:19:06
我正在尝试使用R中的ggnet2包生成一个图,我已经创建了一个网络(net.bg)
library(igraph)
library(GGally)
library(network)
library(sna)
library(intergraph)

direction <- c(2,1,3,1,4,1,5,1,3,2,4,2,5,2,4,3,5,3,5,4)
gr <- matrix(direction, nrow = 2)
x1 <- 10.59
x2 <- 15.74
x3 <- 5
x4 <- 18
x5 <- 7

RImp <- data.frame(x1,x2,x3,x4,x5)
nam <- names(RImp)
RImp <- as.numeric(RImp)
Rint <- c(2.96, 1.34, 1.27, 1.1, 2.22, 1.24, 3.11,
          2.52, 0.96, 1.08)

net.bg <- make_graph(gr, 5)
我使用ggnet2和ggplot2来绘制它,如下所示:
library(RColorBrewer)
library(ggnewscale)
library(ggplot2)


colfunction <- colorRampPalette(c("floralwhite", "firebrick1"))
nodeCol <- colfunction(5)

p   <- ggnet2(net.bg,
              mode = "circle",
              size = 0,
              #color = RImp,
              label = nam,
              edge.size = Rint,
              edge.label = Rint,
              edge.color = "grey") +
  theme(legend.text = element_text(size = 10)) +
  geom_label(aes(label = nam),nudge_y = 0.08) +
  geom_point(aes(fill = RImp), size = RImp, col = nodeCol) +
  scale_fill_continuous(name = "Variable\nImportance",
                        limits=c(0, 20), breaks=seq(0, 20, by= 5),
                        low = "floralwhite" ,high = "firebrick1")
p我使用ggplot2来实际绘制节点,而不是ggnet2,因为这允许我添加一个图例。
上面的代码生成了一个类似于此的图:
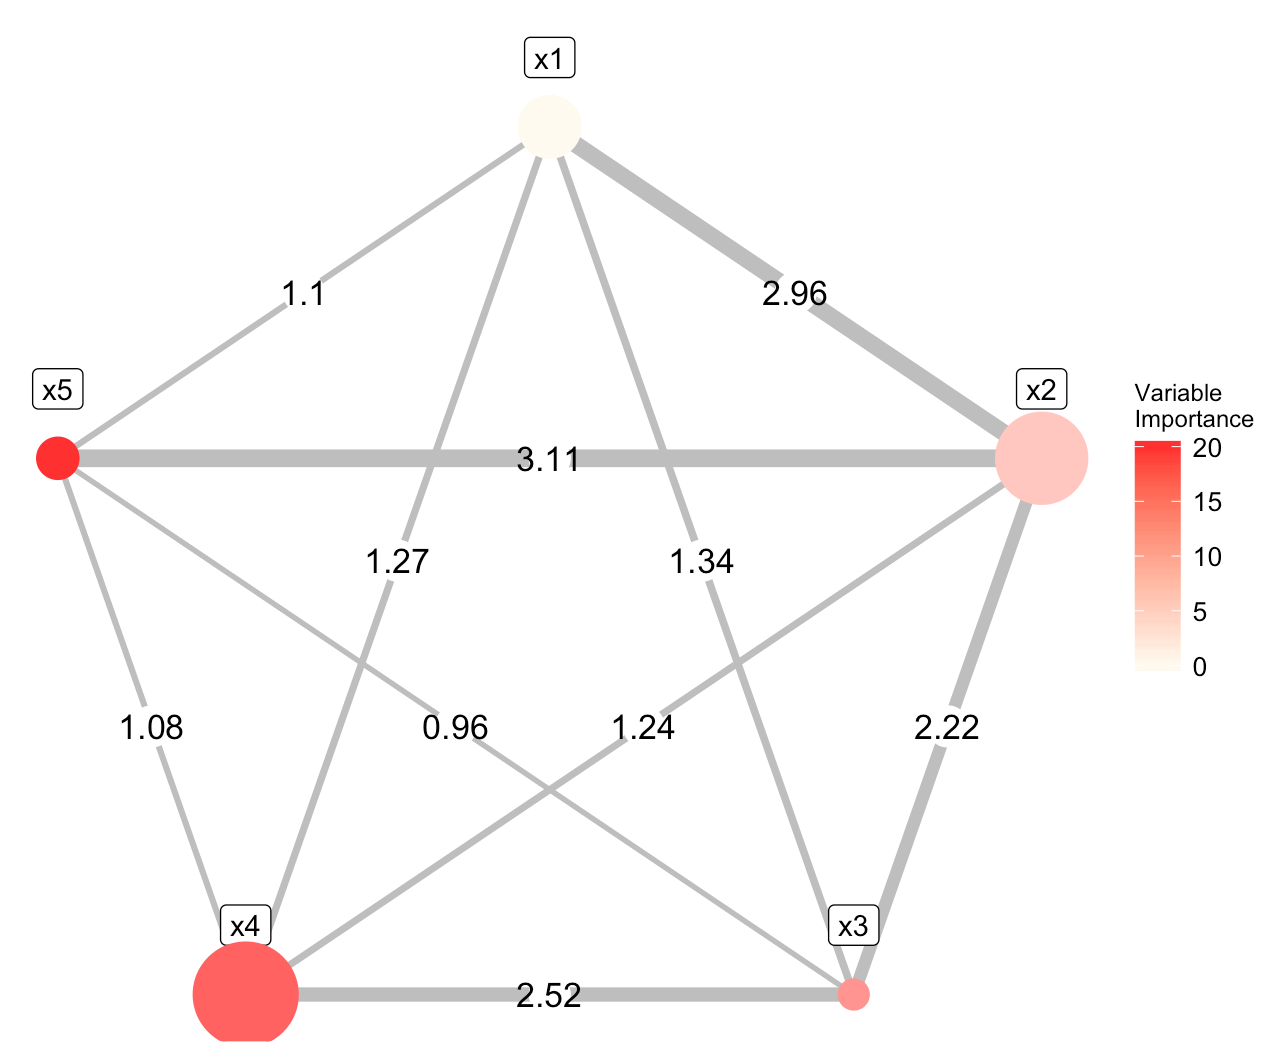
可以看到,节点被着色为一个渐变,然而,它们是按时钟顺序着色的.我试图根据节点的大小(或者在本例中是RImp中包含的值)对节点进行着色。
对于我如何做到这一点,有什么建议吗?
回答 1
Stack Overflow用户
回答已采纳
发布于 2020-02-21 10:59:12
问题是,这些点的形状是实心的,geom_point使用"nodeCol“作为整个点(或者更确切地说是圆形)的颜色。如果您使用的是shape = 21,那么您有机会同时更改点的轮廓(我在这里使用灰色和填充,这现在由scale_fill_continuous正确地控制):
  ggnet2(net.bg,
              mode = "circle",
              size = 0,
              #color = RImp,
              label = nam,
              edge.size = Rint,
              edge.label = Rint,
              edge.color = "grey") +
  theme(legend.text = element_text(size = 10)) +
  geom_label(aes(label = nam),nudge_y = 0.08) +
  geom_point(aes(fill = RImp), size = RImp, col = "grey", shape = 21) +
  scale_fill_continuous(name = "Variable\nImportance",
                        limits=c(0, 20), breaks=seq(0, 20, by= 5),
low = "floralwhite" ,high = "firebrick1")如果您在https://ggplot2.tidyverse.org/reference/geom_point.html上向下滚动,您将发现使用不同点形状的示例。
页面原文内容由Stack Overflow提供。腾讯云小微IT领域专用引擎提供翻译支持
原文链接:
https://stackoverflow.com/questions/60311620
复制相关文章
相似问题
腾讯云开发者

Copyright © 2013 - 2026 Tencent Cloud. All Rights Reserved. 腾讯云 版权所有
深圳市腾讯计算机系统有限公司 ICP备案/许可证号:粤B2-20090059 ![]() 粤公网安备44030502008569号
粤公网安备44030502008569号
腾讯云计算(北京)有限责任公司 京ICP证150476号 | 京ICP备11018762号