
放大/调整RDA绘图上的样式
放大/调整RDA绘图上的样式
提问于 2020-02-21 14:26:56
我是R的新手,我正在用vegan和adespatial软件包获得的一些数据绘制一个RDA图表,生成我的图表如下
图生成的
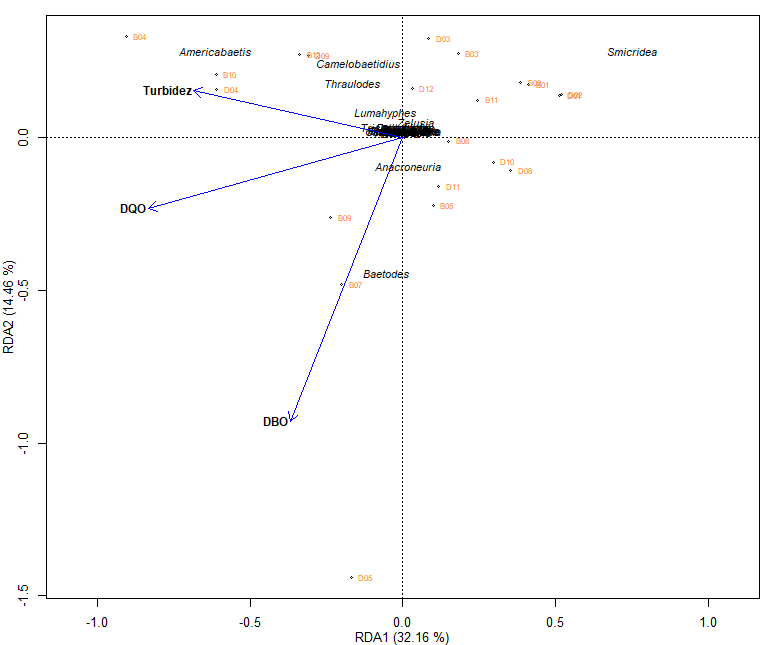
这张图是正确的,但在美学上它是不好的,因为它的解释是困难的,因为你甚至不能欣赏这些名字,我想要的是能够以某种方式修改标度,以便数据看起来更加分散,从而欣赏数据。
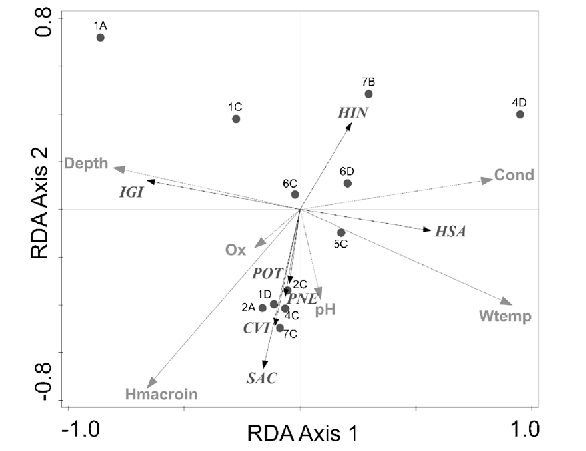
我希望我的图形看起来像这样,你至少可以看到名字的首字母。
样例图
我生成图形的代码如下
windows(width = 12, height = 10)

par(mar=c(3,3,1,1), mgp=c(2,1,0), cex=0.8, maii=c(0.1,0.1,0.2,0.1))

plot(str.rda, xlab="RDA1 (32.16 %)", ylab="RDA2 (14.46 %)", display=c("cn", "lc", "sp"), type="n", xlim=c(-0.8,0.8),correlation=TRUE)

sites.sc <- scores(str.rda, choices=1:2, scaling=2, display="lc")
points(sites.sc, pch=1, cex=0.5)
text(sites.sc,row.names(sites.sc), cex = 0.6, pos = 4, col = "chocolate1")

va.sc <- scores(str.rda, choices=1:2, scaling=2, display="sp")
sp.names<- c("Americabaetis", "Baetodes", "Camelobaetidius", "Cloeodes", "Nanomis","Varipes","Zelusia","Caenis", "Trichorythodes",  "Lumahyphes","Farrodes","Thraulodes", "Anacroneuria", "Protoptila","Helicopsyche", "Leptonema", "Smicridea", "Alisotrichia", "Celaenotrichia", "Cerasmatrichia", "Hydroptila", "Metrichia", "Neotrichia", "Orthotrichia", "Oxyethira", "Rhyacopsyche", "Chimarra")
text(va.sc[c(1,2,3,4,5,6,7,8,9,10, 11, 12, 13, 14, 15, 16, 17, 18, 19, 20, 21,22, 23, 24, 25, 26, 27 ),], sp.names[c(1,2,3,4,5,6,7,8,9,10, 11, 12, 13, 14, 15, 16, 17, 18, 19, 20, 21,22, 23, 24, 25, 26, 27 )], cex=0.8, font=3, pos=3,offset=0.1)

env.sc <- scores(str.rda, choices=1:2, scaling=2, display="bp")
arrows(0,0, env.sc[1:3,1], env.sc[1:3,2], lty=1, lwd=1, col="Blue", length=0.1)

env.names <- c("DQO", "DBO", "Turbidez")
text(env.sc[c(1,2,3),], env.names[c(1,2,3)], cex=0.9, font=2, pos=2,offset = 0.1)我正在阅读,我发现了几种选择,比如修改xlim (最低值,最高值)和ylim (最低值,最高值),但是图表总是以同样的方式出现,所以我不知道我能做些什么来从美学上改进它,我感谢您的关注和帮助。
回答 1
Stack Overflow用户
回答已采纳
发布于 2020-02-21 14:59:30
您应该注意的一件事是,使用plot(str.rda)实际上将调用不作为plot.default()行为的vegan:::plot.cca()。为了克服这一问题,您可以简单地使用带有两点的空图:
plot(c(-1, 1), c(-.8, .8), xlab="RDA1 (32.16 %)", ylab="RDA2 (14.46 %)", type="n")
abline(h = 0, v = 0, lty = 2, lwd =.5) # add x=0 and y=0 guide lines
# then you can add the rest of your code请注意,使用此方法,xlim和ylim的行为将与您预期的一样。希望这能有所帮助。
页面原文内容由Stack Overflow提供。腾讯云小微IT领域专用引擎提供翻译支持
原文链接:
https://stackoverflow.com/questions/60340633
复制相关文章
相似问题
腾讯云开发者

Copyright © 2013 - 2026 Tencent Cloud. All Rights Reserved. 腾讯云 版权所有
深圳市腾讯计算机系统有限公司 ICP备案/许可证号:粤B2-20090059 ![]() 粤公网安备44030502008569号
粤公网安备44030502008569号
腾讯云计算(北京)有限责任公司 京ICP证150476号 | 京ICP备11018762号