
在cowplot::plot_grid中设置多面板图中单个面板的宽度和高度
在cowplot::plot_grid中设置多面板图中单个面板的宽度和高度
提问于 2020-03-27 02:52:54
我正在使用ggplot2和cowplot包制作一个多面板的图形,但我需要更改单个绘图的高度。最简单的例子就是
library(ggplot2)
library(cowplot)

p1 <- ggplot(iris, aes(Sepal.Width, Sepal.Length, colour = Species)) +
             geom_point() +
             theme(axis.text.x = element_blank(),
                   axis.title.x = element_blank(),
                   legend.position = "none")
p2 <- ggplot(iris, aes(Sepal.Width, Sepal.Length, colour = Species)) +
             geom_point() +
             theme(axis.text.x = element_blank(),
                   axis.title.x = element_blank(),
                   axis.text.y = element_blank(),
                   axis.title.y = element_blank(),
                   legend.position = "none")
p3 <- ggplot(iris, aes(Sepal.Width, Sepal.Length, colour = Species)) +
             geom_point() +
             theme(axis.text.y = element_blank(),
                   axis.title.y = element_blank(),
                   legend.position = "none")
p4 <- ggplot(iris, aes(Sepal.Width, Sepal.Length, colour = Species)) +
             geom_point() +
             theme(legend.position = "none")
p5 <- ggplot(iris, aes(Sepal.Width, Sepal.Length, colour = Species)) +
             geom_point() +
             theme(axis.text.y = element_blank(),
                   axis.title.y = element_blank(),
                   legend.position = "none")

pL <- ggplot(iris, aes(Sepal.Width, Sepal.Length, colour = Species)) + geom_point()
l <- get_legend(pL)

# simple grid
plot_grid(p1, p2, p3, p4, p5, l, ncol = 3)
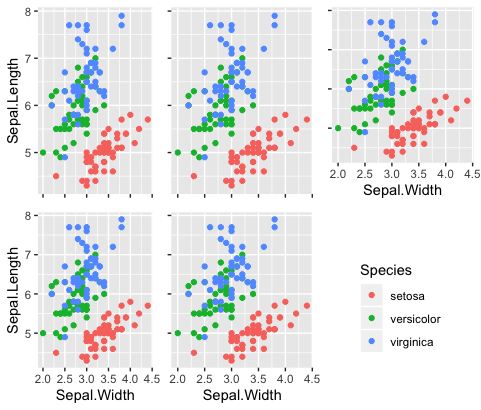
如您所见,右上面板中的y轴与同一行中的另外两个面板相比,由于包含了x轴标题而缩小了。
那么,如何设置这个单一面板的相对高度和宽度,以便y-轴与顶部行中面板的y轴对齐?
不能使用rel_heights =和rel_widths() =参数设置单个面板,而且当我尝试添加axis = "tblr"和align = "hv"参数时,会得到错误消息。
Error in `[.unit.list`(sizes[[x]], list_indices[[x]]) :
index out of bounds (unit list subsetting) 回答 1
Stack Overflow用户
发布于 2020-03-27 17:11:29
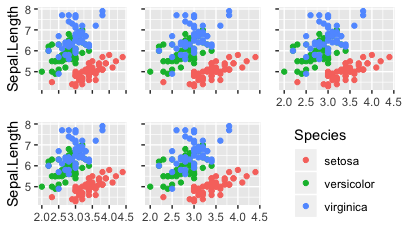
@董的回答很棒,但我也想出了如何在牛仔故事中这样做。您只需创建两个单独的面板,每一行一个,然后可以使用align=和axis=参数对齐y轴。我们在水平参考线的基础上垂直对齐y轴,因此我们指定了line= "h“。
top_row <- plot_grid(p1, p2, p3, align = "h", axis = "l", ncol = 3)

bottom_row <- plot_grid(p4, p5, l, align = "h", axis = "l", ncol = 3)

plot_grid(top_row, bottom_row, ncol = 1)
页面原文内容由Stack Overflow提供。腾讯云小微IT领域专用引擎提供翻译支持
原文链接:
https://stackoverflow.com/questions/60879339
复制相关文章
相似问题
腾讯云开发者

Copyright © 2013 - 2026 Tencent Cloud. All Rights Reserved. 腾讯云 版权所有
深圳市腾讯计算机系统有限公司 ICP备案/许可证号:粤B2-20090059 ![]() 粤公网安备44030502008569号
粤公网安备44030502008569号
腾讯云计算(北京)有限责任公司 京ICP证150476号 | 京ICP备11018762号