
python中数据文件中的聚类值
python中数据文件中的聚类值
提问于 2020-03-27 13:18:16
我有一个有76列的数据。第一列包含日期值,其余75列是来自75个不同钻孔的地下水位。我想根据趋势对钻孔进行聚类(遵循相同模式的钻孔被组合在一起)。我怎么能在蟒蛇身上做到这一点呢?
这是我的数据样本
df = pd.DataFrame({
'Date': [1980, 1985, 1990, 1995, 2000],
'borehole1': [53, 43, 33, 22, 18],
'borehole2': [50, 40, 30, 50, 40],
'borehole3': [22, 32, 42, 32, 13],
'borehole4': [60, 65, 82, 72, 60],
'borehole5': [80, 70, 60, 80, 70],
'borehole6': [43, 33, 22, 18, 13]
})

df.plot()
因此,在本例中,我将有三个集群:
- borehole1 &钻孔6 >>群集1
- borehole2 &钻孔5 >>群集2
- 钻孔4和钻孔3 >>群集3
回答 1
Stack Overflow用户
回答已采纳
发布于 2020-04-05 02:16:30
K-意思是,阿尔戈是完美的这一点!这是一个样本(下面)。只需将X和y指向特定的数据集,并将'K‘设置为3(在本例中已经为您完成)。
# K-MEANS CLUSTERING
# Importing Modules
from sklearn import datasets
from sklearn.cluster import KMeans
import matplotlib.pyplot as plt
from sklearn.decomposition import PCA
# Loading dataset
iris_df = datasets.load_iris()
# Declaring Model
model = KMeans(n_clusters=3)
# Fitting Model
model.fit(iris_df.data)
# Predicitng a single input
predicted_label = model.predict([[7.2, 3.5, 0.8, 1.6]])
# Prediction on the entire data
all_predictions = model.predict(iris_df.data)
# Printing Predictions
print(predicted_label)
print(all_predictions)
# import some data to play with
iris = datasets.load_iris()
X = iris.data[:, :3] # we only take the first two features.
y = iris.target
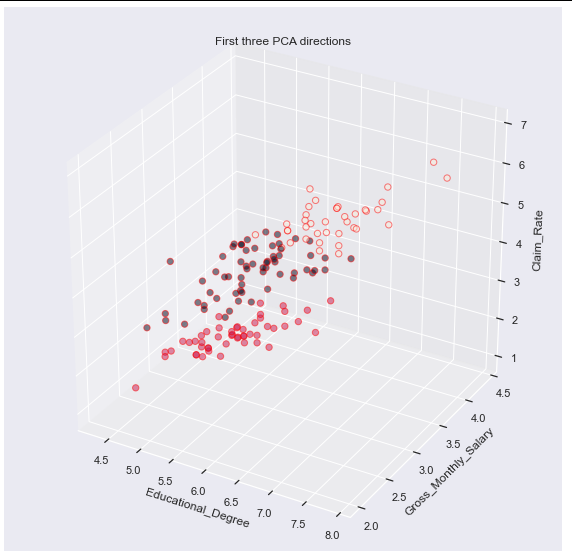
fig = plt.figure(figsize=(10,10))
plt = fig.add_subplot(111, projection='3d')
plt.scatter(X[:,0],X[:,1],X[:,2],
c=all_predictions, edgecolor='red', s=40, alpha = 0.5)
plt.set_title("First three PCA directions")
plt.set_xlabel("Educational_Degree")
plt.set_ylabel("Gross_Monthly_Salary")
plt.set_zlabel("Claim_Rate")
plt.dist = 10
plt
有关更多信息,请参阅此链接。
https://scikit-learn.org/stable/auto_examples/datasets/plot_iris_dataset.html
页面原文内容由Stack Overflow提供。腾讯云小微IT领域专用引擎提供翻译支持
原文链接:
https://stackoverflow.com/questions/60886832
复制相关文章
相似问题
腾讯云开发者

Copyright © 2013 - 2026 Tencent Cloud. All Rights Reserved. 腾讯云 版权所有
深圳市腾讯计算机系统有限公司 ICP备案/许可证号:粤B2-20090059 ![]() 粤公网安备44030502008569号
粤公网安备44030502008569号
腾讯云计算(北京)有限责任公司 京ICP证150476号 | 京ICP备11018762号