
如何将子图添加到树图中的每个矩形中?
如何将子图添加到树图中的每个矩形中?
提问于 2020-04-01 08:05:30
我使用Matplotlib和Squarify创建了这个树映射:
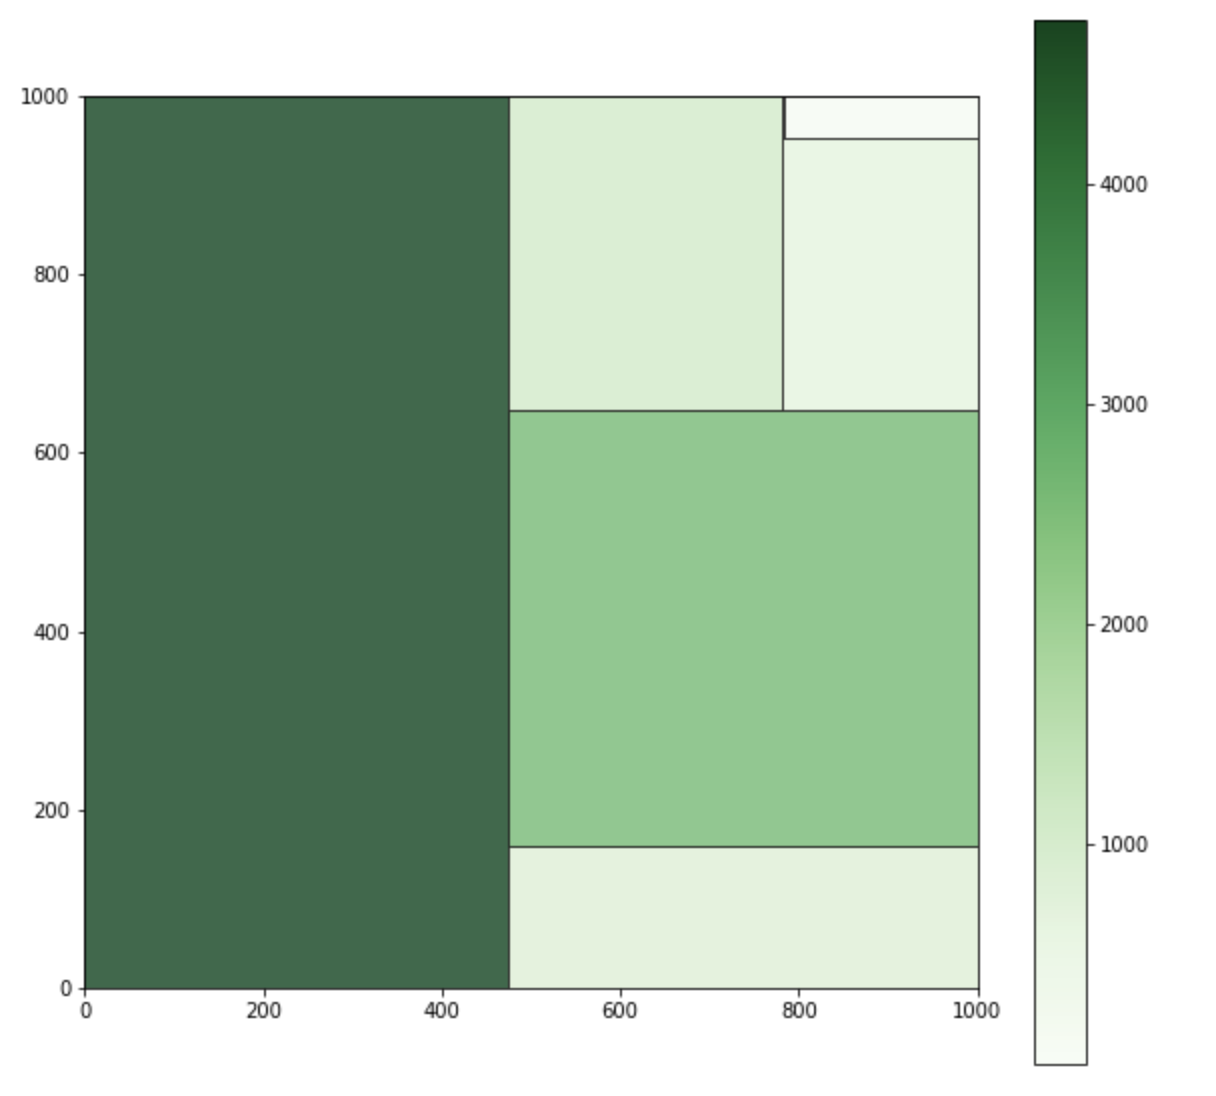
现在,我想在树图中的每个矩形上添加一个线图。这有可能吗?
回答 2
Stack Overflow用户
回答已采纳
发布于 2020-04-01 10:00:04
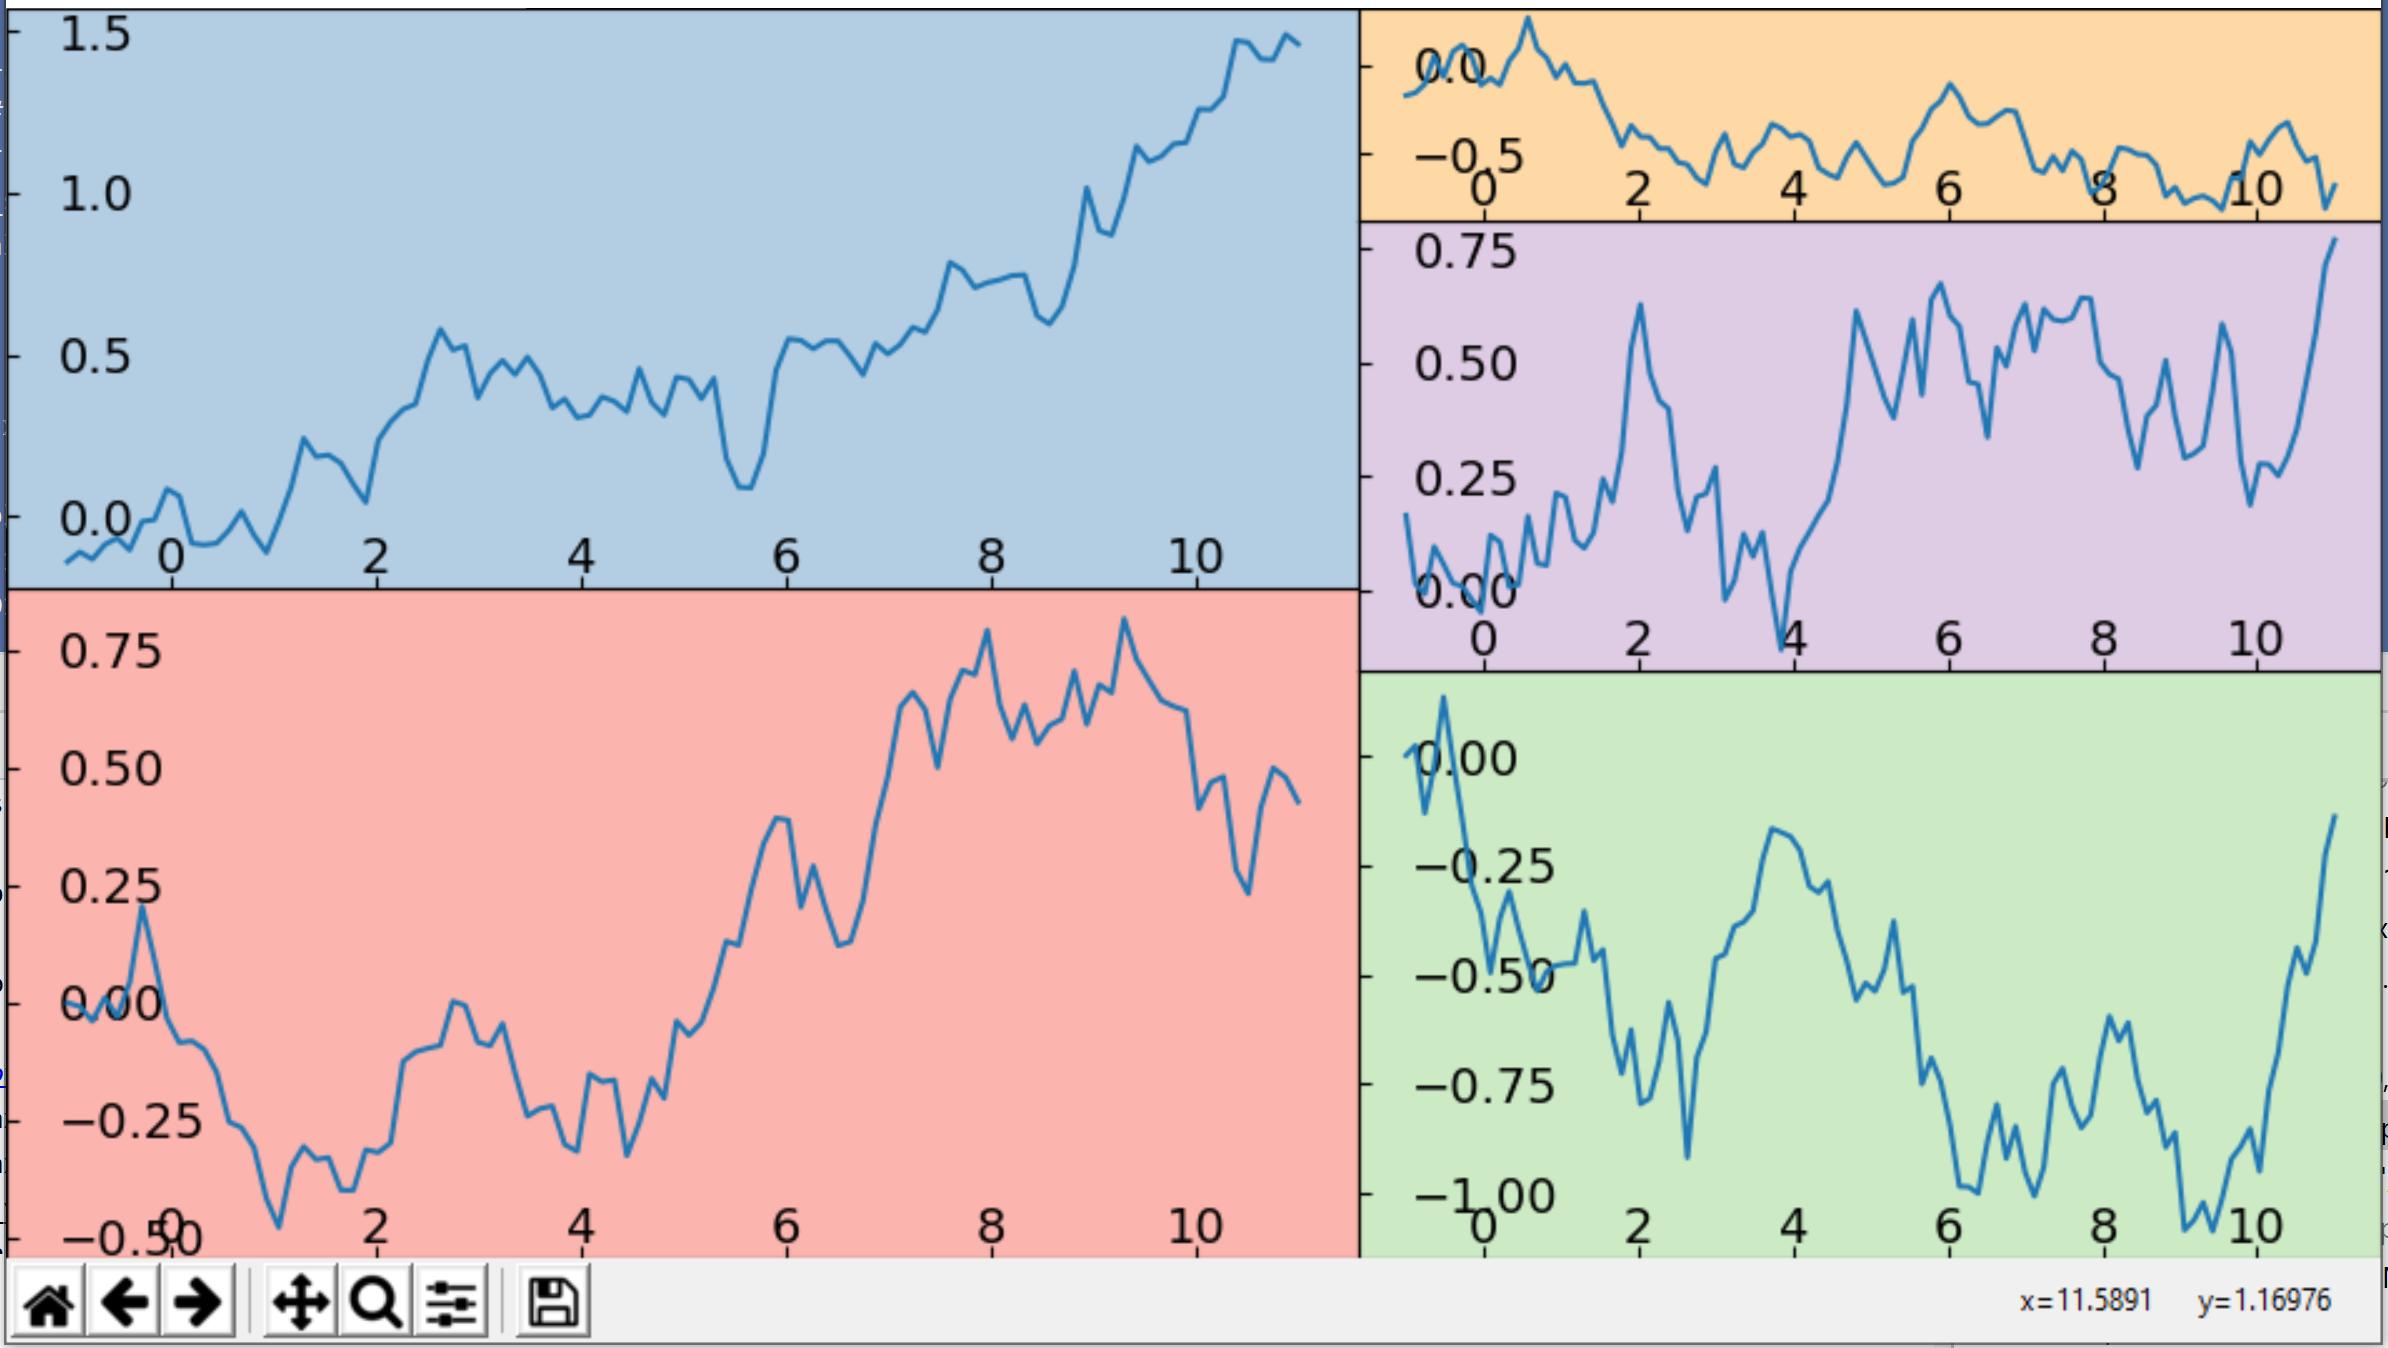
正方形的绘图是一个方便的函数,可以直接绘制给定值和标签的树状图。但是,这个过程也可以一步一步地执行。其中一个步骤是计算矩形的位置,我们假设一个从左下角到右上角坐标为0,0到1,1的图形。
使用这些矩形,我们可以手动定位轴来绘制。目前尚不清楚是否需要滴答声。如果需要,它们可以是放在里面。或者将轴完全移动到每个子图的中心。或者只有刻有标签的滴答。
下面是一些演示代码:
import numpy as np
import matplotlib.pyplot as plt
import squarify

values = [500, 433, 331, 254, 119]
values.sort(reverse=True)  # values must be sorted descending (and positive)
# the sum of the values must equal the total area to be laid out; i.e., sum(values) == width * height
values = squarify.normalize_sizes(values, 1, 1)
rects = squarify.squarify(values, 0, 0, 1, 1)

fig = plt.figure(figsize=(7, 5))

axes = [fig.add_axes([rect['x'], rect['y'], rect['dx'], rect['dy'], ]) for rect in rects]

for ax, color in zip(axes, plt.cm.Pastel1.colors):
    x = np.linspace(0, 10, 100)
    y = np.random.normal(0.01, 0.1, 100).cumsum()
    ax.plot(x, y)
    ax.tick_params(axis="y", direction="in", pad=-15)
    ax.tick_params(axis="x", direction="in", pad=-15)
    plt.setp(ax.get_yticklabels(), ha="left")
    ax.set_facecolor(color)
plt.show()
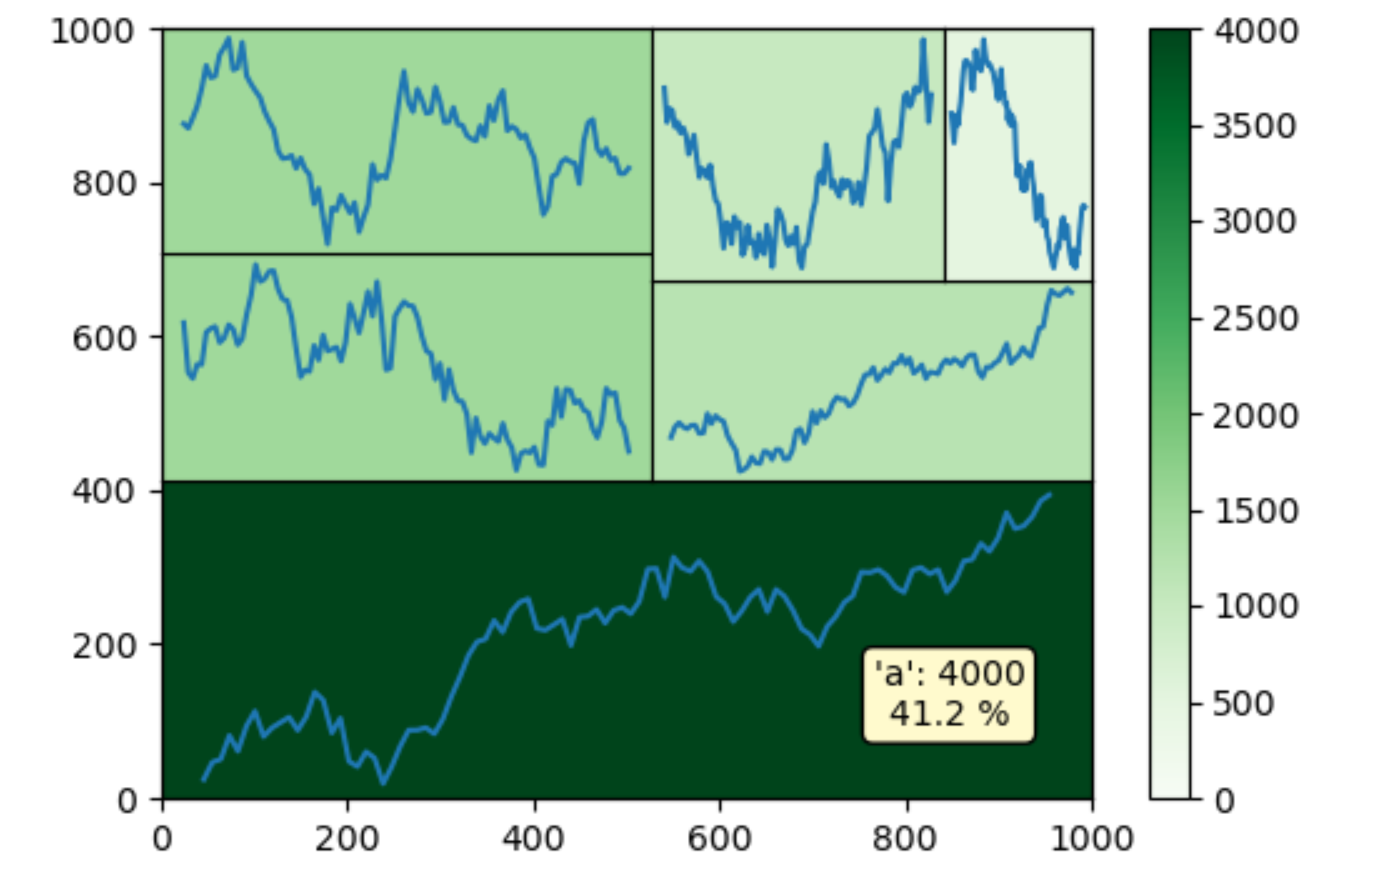
这是另一个类似于问题中的图像的例子,它有一个主要的情节和一个色条。默认的mplcur标与所有这些轴混淆,但也可以手动添加徘徊时的注解。
import numpy as np
import matplotlib.pyplot as plt
import squarify

values = [4000, 1500, 1500, 1200, 1000, 500]

fig, mainax = plt.subplots(figsize=(6, 4))

mainax.set_xlim(0, 1000)
mainax.set_ylim(0, 1000)
mainax.grid(False)
cmap = plt.cm.get_cmap('Greens')
norm = plt.Normalize(vmin=0, vmax=max(values))
plt.colorbar(plt.cm.ScalarMappable(cmap=cmap, norm=norm))
pos = mainax.get_position()

values.sort(reverse=True)
normalized_values = squarify.normalize_sizes(values, pos.width, pos.height)
rects = squarify.squarify(normalized_values, pos.x0, pos.y0, pos.width, pos.height)

axes = [fig.add_axes([rect['x'], rect['y'], rect['dx'], rect['dy'], ]) for rect in rects]

for ax, val in zip(axes, values):
    x = np.linspace(0, 10, 100)
    y = np.random.normal(0.01, 0.1, 100).cumsum()
    ax.plot(x, y)
    ax.set_xticks([])
    ax.set_yticks([])
    ax.set_facecolor(cmap(norm(val)))
mainax.set_facecolor('none') # prevent that the mainax blocks the other axes
mainax.set_zorder(20) # high z-order because the annotations are drawn using this ax

labels = ['a', 'b', 'c', 'd', 'e', 'f']
sum_val = sum(values)
annotations = [mainax.annotate(f"'{lbl}': {val}\n{val * 100.0 / sum_val:.1f} %",
                               xy=(0, 0), xycoords='figure pixels',
                               xytext=(0, 0), textcoords='offset points',
                               bbox=dict(boxstyle='round', fc='lemonchiffon'),
                               ha='center', va='bottom')
               for ax, val, lbl in zip(axes, values, labels)]
for annot in annotations:
    annot.set_visible(False)

def hover(event):
    for ax, annot in zip(axes, annotations):
        if ax.bbox.contains(event.x, event.y):
            annot.xy = (event.x, event.y)
            annot.set_visible(True)
        else:
            annot.set_visible(False)
    fig.canvas.draw_idle()

fig.canvas.mpl_connect("motion_notify_event", hover)

plt.show()
Stack Overflow用户
发布于 2020-04-01 08:09:43
是的是可能的。您必须编写代码来提取要放置新情节的确切位置。
您需要使用f.canvas.manager.window.SetPosition设置新图形的位置
页面原文内容由Stack Overflow提供。腾讯云小微IT领域专用引擎提供翻译支持
原文链接:
https://stackoverflow.com/questions/60966190
复制相关文章
相似问题
腾讯云开发者

Copyright © 2013 - 2026 Tencent Cloud. All Rights Reserved. 腾讯云 版权所有
深圳市腾讯计算机系统有限公司 ICP备案/许可证号:粤B2-20090059 ![]() 粤公网安备44030502008569号
粤公网安备44030502008569号
腾讯云计算(北京)有限责任公司 京ICP证150476号 | 京ICP备11018762号