
平滑geom_ribbon
平滑geom_ribbon
提问于 2020-04-03 13:27:24
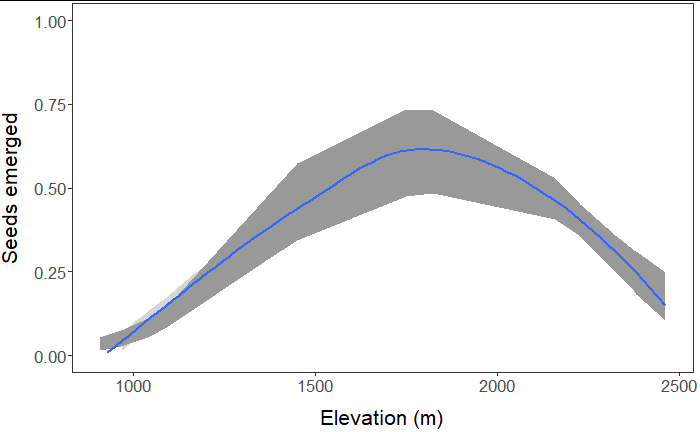
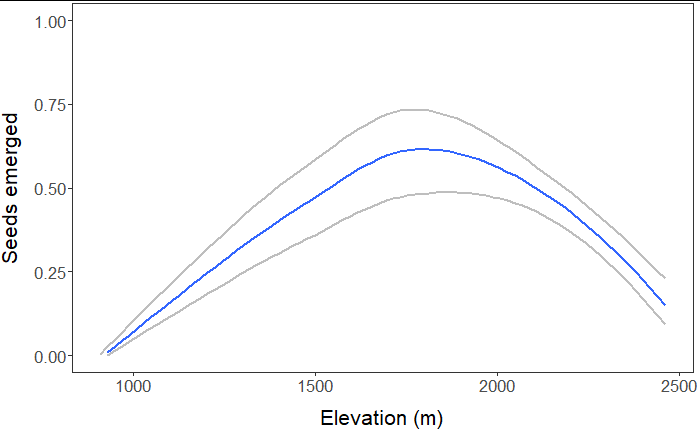
我用geom_line和geom_ribbon (图1)创建了一个情节,结果是可以的,但为了美观起见,我希望线条和丝带更加流畅。我知道我可以用geom_smooth来表示线条(图2),但我不确定是否可以平滑核糖核酸,我可以为丝带的顶部和底部创建一条geom_smooth线(图3),但这两条线之间是否存在填充空间呢?

回答 1
Stack Overflow用户
回答已采纳
发布于 2020-04-03 18:00:29
实现所需目标的一种原则方法是使用mgcv中的gam()函数将GAM模型与您的数据相匹配,然后在更精细的预测变量值网格上将预测()函数应用于该模型。网格可以覆盖由预测变量的观察值范围定义的跨度。下面的R代码举例说明了这个过程。
# load R packages
library(ggplot2)
library(mgcv)

# simulate some x and y data
# x = predictor; y = response
x <- seq(-10, 10, by = 1)
y <- 1 - 0.5*x - 2*x^2 + rnorm(length(x), mean = 0, sd = 20)
d <- data.frame(x,y)

# plot the simulated data
ggplot(data = d, aes(x,y)) +
geom_point(size=3)

# fit GAM model
m <- gam(y ~ s(x), data = d)

# define finer grid of predictor values
xnew <- seq(-10, 10, by = 0.1)

# apply predict() function to the fitted GAM model
# using the finer grid of x values
p <- predict(m, newdata = data.frame(x = xnew), se = TRUE)
str(p)

# plot the estimated mean values of y (fit) at given x values
# over the finer grid of x values;
# superimpose approximate 95% confidence band for the true
# mean values of y at given x values in the finer grid
g <- data.frame(x = xnew,
            fit = p$fit,
            lwr = p$fit - 1.96*p$se.fit,
            upr = p$fit + 1.96*p$se.fit)

head(g)

theme_set(theme_bw())

ggplot(data = g, aes(x, fit)) +
geom_ribbon(aes(ymin = lwr, ymax = upr), fill = "lightblue") +
geom_line() +
geom_point(data = d, aes(x, y), shape = 1)
如果要使用lm()函数对数据拟合多项式回归模型,同样的原则也适用。
页面原文内容由Stack Overflow提供。腾讯云小微IT领域专用引擎提供翻译支持
原文链接:
https://stackoverflow.com/questions/61029929
复制相关文章
相似问题
腾讯云开发者

Copyright © 2013 - 2026 Tencent Cloud. All Rights Reserved. 腾讯云 版权所有
深圳市腾讯计算机系统有限公司 ICP备案/许可证号:粤B2-20090059 ![]() 粤公网安备44030502008569号
粤公网安备44030502008569号
腾讯云计算(北京)有限责任公司 京ICP证150476号 | 京ICP备11018762号