
如何减少sns.jointplot()中的数据点大小?
如何减少sns.jointplot()中的数据点大小?
提问于 2020-04-07 15:53:52
下面的代码绘制了一个海运连接图。然而,我似乎不知道如何改变数据点的大小。我需要它们再小一点。我尝试了关键字s,它似乎适用于其他海图,但是这里我得到了错误:
TypeError: regplot() got an unexpected keyword argument 's'有人知道怎么调整吗?
g = plt.figure(figsize=(12, 10))

g = (sns.jointplot("age", "months_as_customer",
                   data=matrix_ks.to_pandas(), color="green", s=0.2, kind="reg")
                  .set_axis_labels("Age", "Months as Customer",  fontsize=15))

#g = g.annotate(fontsize=18)
plt.title("Joint Density Estime - Age and Months as Customer", pad= 80, fontsize=15)


plt.show()回答 1
Stack Overflow用户
回答已采纳
发布于 2020-04-07 16:04:11
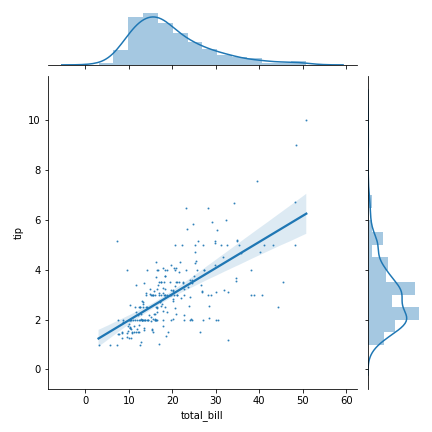
由于您将kind定义为正则图,因此需要通过参数scatter_kws传递散点图参数。您可以查看正则图文档以了解更多细节。
df = sns.load_dataset('tips')
sns.jointplot('total_bill', 'tip', df, kind='reg', scatter_kws={'s': 1})
页面原文内容由Stack Overflow提供。腾讯云小微IT领域专用引擎提供翻译支持
原文链接:
https://stackoverflow.com/questions/61084145
复制相关文章
相似问题
腾讯云开发者

Copyright © 2013 - 2026 Tencent Cloud. All Rights Reserved. 腾讯云 版权所有
深圳市腾讯计算机系统有限公司 ICP备案/许可证号:粤B2-20090059 ![]() 粤公网安备44030502008569号
粤公网安备44030502008569号
腾讯云计算(北京)有限责任公司 京ICP证150476号 | 京ICP备11018762号