
Dc.js :无法使用顺序排序我的条形图
index.js 85号线。
排序函数无法工作,因为我不能获得console.log()的输出。我不知道为什么这个案子不管用。对于我的rowChart,我能够使用.ordering()按降序排序
下面是带有代码的演示:https://blockbuilder.org/ninjakx/483fd69328694c6b6125bb43b9f7f8a7
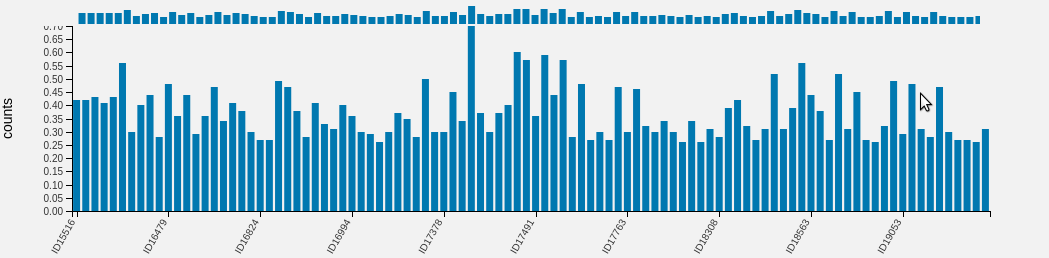
我希望将这些图按值排序,但不能这样做。
更新:
在这回答之后,我想出了这个解决方案(在一个虚拟的情况下尝试过)。但是只有当我使用没有reduceCount()的reduceSum()函数(也就是没有reductio.js的函数)时,这才有效。
我使用reductio.js从组中获得最大值。
var data = crossfilter([
{ foo: 'one', bar: 1 },
{ foo: 'two', bar: 2 },
{ foo: 'three', bar: 3 },
{ foo: 'one', bar: 4 },
{ foo: 'one', bar: 5 },
{ foo: 'two', bar: 6 },
]);
var dim = data.dimension(function(d) { return d.foo; });
var group = dim.group();
let TypeGroup = group.reduceCount(function(d) {
return d.bar; }
);
TypeGroup.order(function(p) {
return p;
});
TypeGroup.all = function() {
return group.top(Infinity);
}
focus = new dc.barChart('#focus');
//
focus
// .ordering(function(d){return -d.value.max})
//dimensions
//.width(768)
.height(250)
.margins({top: 10, right: 50, bottom: 25, left: 50})
//x-axis
.x(d3.scaleOrdinal())
.xUnits(dc.units.ordinal)
.xAxisLabel('Department')
//left y-axis
.yAxisLabel('Sales')
.elasticY(true)
.renderHorizontalGridLines(true)
//composition
.dimension(dim)
.group(TypeGroup)
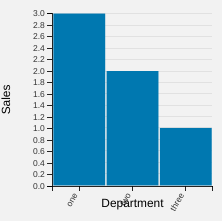
focus.ordering(function(d){
return -d
}); 输出:
还原剂的:
       var data = crossfilter([
        { foo: 'one', bar: 1 },
        { foo: 'two', bar: 2 },
        { foo: 'three', bar: 3 },
        { foo: 'one', bar: 4 },
        { foo: 'one', bar: 5 },
        { foo: 'two', bar: 6 },
      ]);

      var dim = data.dimension(function(d) { return d.foo; });
      var group = dim.group();
      // let TypeGroup = group.reduceCount(function(d) {
      //     return d.bar; }
      //     );

      var reducer_g = reductio().max(function(d) {
          // console.log("max:",d.Time_estimate);
          return parseFloat(d.bar)
      });

      let TypeGroup = reducer_g(group);


      TypeGroup.order(function(p) {
        console.log(p);
          return p.max;
      });

      TypeGroup.all = function() {
          return group.top(Infinity);
      }

        focus = new dc.barChart('#focus');
//
      focus
          // .ordering(function(d){return -d.value.max})
          //dimensions
          //.width(768)
          .height(250)
          .margins({top: 10, right: 50, bottom: 25, left: 50})
          //x-axis
          .x(d3.scaleOrdinal())
          .xUnits(dc.units.ordinal)
          .xAxisLabel('Department')
          //left y-axis
          .yAxisLabel('Sales')
          .elasticY(true)
          .renderHorizontalGridLines(true)
          //composition
          .dimension(dim)
          .group(TypeGroup)

      focus.ordering(function(d){
          return -d.value.max
      });
输出:
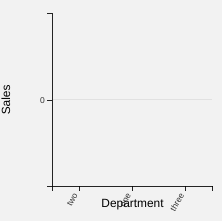
所以你可以看到我没有得到任何酒吧。因此,我假设我非常接近解决方案,因为我在控制台中没有任何错误。我相信,如果我让它在这种情况下工作,那么我将能够排序的原始图形使用同样的。
回答 1
Stack Overflow用户
发布于 2020-04-10 17:15:43
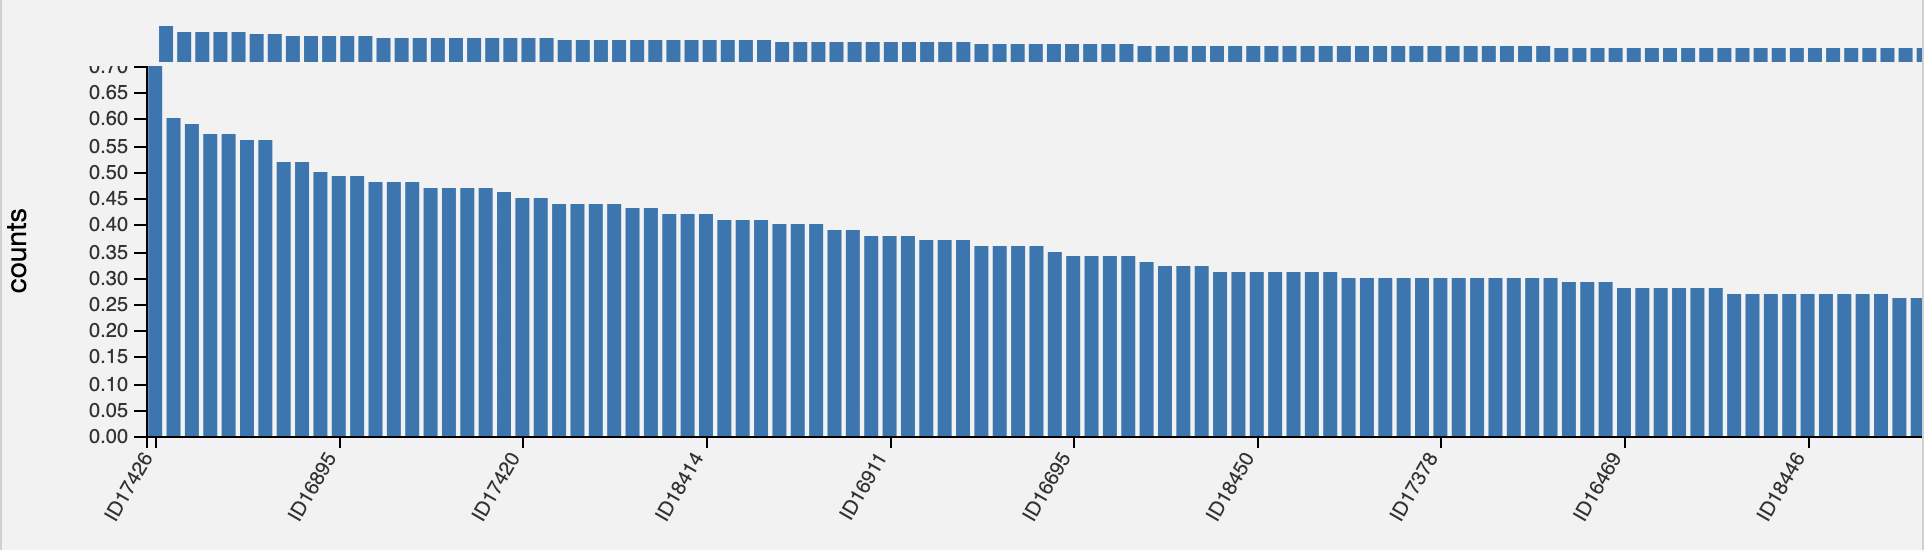
为了总结您的问题,您需要一个序号范围/焦点条形图,并按降序排列条形图。为了使事情更有趣,使用reductio.max减少了组数。
我认为重写.all()来使用组的order调用.top()的想法是错误的(尽管它可能会起作用)。
在您在序数焦点/距离图示例中使用的bl.ock (谢谢!)中,我们按顺序将序号键映射为线性比例的整数。
在进行映射之前,很容易对值进行排序,看起来ordinal_to_linear_group函数通过将sort作为第二个参数来预测需要。然而,它没有实现,所以让我们添加它!
function ordinal_to_linear_group(group, sort) {
    var _ord2int, _int2ord;
    return {
        all: function() {
            var ret = group.all();
            if(sort) // NEW
              ret = ret.slice().sort(sort);
            _ord2int = {};
            _int2ord = [];
            ret.forEach(function(d, i) {
                _ord2int[d.key] = i;
                _int2ord[i] = d.key;
            });
            return ret;
        },
        ord2int: function(o) {
            if(!_ord2int)
                this.all();
            return _ord2int[o];
        },
        int2ord: function(i) {
            if(!_int2ord)
                this.all();
            return _int2ord[i];
        }
    };
}我们需要对副本进行slice,然后对其进行排序,因为group.all()正在返回它的内部状态,如果您更改该数组,它会感到困惑。
它采用标准的Array.sort比较器功能,我们可以使用d3.descending提供它。
     var group = ordinal_to_linear_group(barTypeGroup,
                    (a,b) => d3.descending(a.value.max, b.value.max));
https://stackoverflow.com/questions/61135290
复制相似问题
腾讯云开发者

Copyright © 2013 - 2026 Tencent Cloud. All Rights Reserved. 腾讯云 版权所有
深圳市腾讯计算机系统有限公司 ICP备案/许可证号:粤B2-20090059 ![]() 粤公网安备44030502008569号
粤公网安备44030502008569号
腾讯云计算(北京)有限责任公司 京ICP证150476号 | 京ICP备11018762号