
在python中是否有一种使用matplotlib创建一个包含子图的图形的方法?
在python中是否有一种使用matplotlib创建一个包含子图的图形的方法?
提问于 2020-04-11 17:41:56
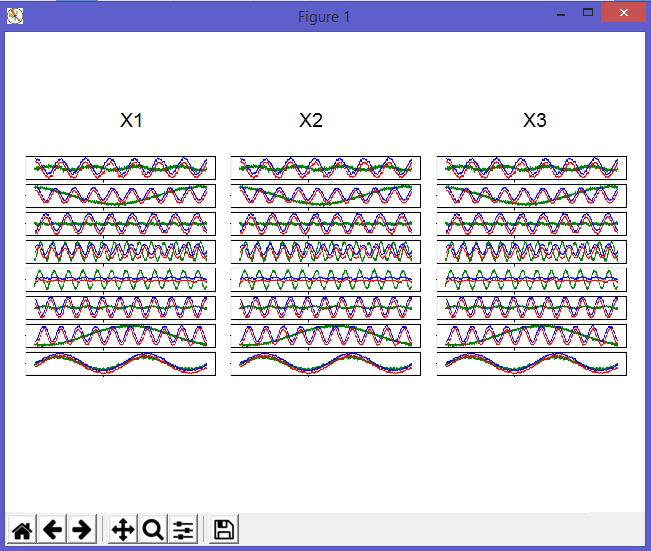
我试图显示一个包含3幅图的图形,每一幅图都是(8,1)-shaped子图的一个图。
本质上,我想要一个大图,每个部分包含(8,1)-shaped子图。
我正在寻找一种方法来做到这一点,而不必手动设置所有比例和间距。我这么做的原因是将一个8通道的神经信号与另外三个预定义的信号进行对比,每个信号是8个通道。
如果这样有意义的话,我正在尝试这样的东西(虚构的代码):
fig, ax = plt.subplots(n_figures = 3, n_rows = 8, n_cols = 1)
ax[figure_i, row_j, col_k].imshow(image)
有办法这样做吗?
这里是我所说的例子。理想情况下,它会有三个子图,每个子图中都有一组形状为8x1的子图。我理解如何通过遍历所有的边距和设置比例来画出所有这些,但我想知道是否有更简单的方法可以做到这一点,而不必像我在上面编写的示例代码中所描述的那样遍历所有额外的代码和设置。
回答 1
Stack Overflow用户
发布于 2021-01-26 21:11:22
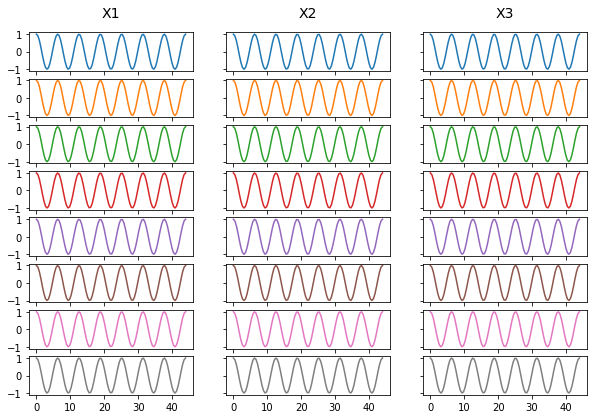
您可以创建这种图形,方法是首先使用plt.subplots()函数创建具有适当布局的子图网格,然后遍历轴数组绘制数据,如本例所示:
import numpy as np                 # v 1.19.2
import matplotlib.pyplot as plt    # v 3.3.2

# Create sample signal data as a 1-D list of arrays representing 3x8 channels
signal_names = ['X1', 'X2', 'X3']
nsignals = len(signal_names)  # ncols of the subplot grid
nchannels = 8  # nrows of the subplot grid
nsubplots = nsignals*nchannels
x = np.linspace(0, 14*np.pi, 100)
y_signals = nsubplots*[np.cos(x)]

# Set subplots width and height
subp_w = 10/nsignals  # 10 corresponds the figure width in inches
subp_h = 0.25*subp_w

# Create figure and subplot grid with the appropriate layout and dimensions
fig, axs = plt.subplots(nchannels, nsignals, sharex=True, sharey=True,
                        figsize=(nsignals*subp_w, nchannels*subp_h))

# Optionally adjust the space between the subplots: this can also be done by
# adding 'gridspec_kw=dict(wspace=0.1, hspace=0.3)' to the above function
# fig.subplots_adjust(wspace=0.1, hspace=0.3)

# Loop through axes to create plots: note that the list of axes is transposed
# in this example to plot the signals one after the other column-wise, as
# indicated by the colors representing the channels
colors = nsignals*plt.get_cmap('tab10').colors[:nchannels]
for idx, ax in enumerate(axs.T.flat):
    ax.plot(x, y_signals[idx], c=colors[idx])
    if ax.is_first_row():
        ax.set_title(signal_names[idx//nchannels], pad=15, fontsize=14)

plt.show()
页面原文内容由Stack Overflow提供。腾讯云小微IT领域专用引擎提供翻译支持
原文链接:
https://stackoverflow.com/questions/61161105
复制相关文章
相似问题
腾讯云开发者

Copyright © 2013 - 2026 Tencent Cloud. All Rights Reserved. 腾讯云 版权所有
深圳市腾讯计算机系统有限公司 ICP备案/许可证号:粤B2-20090059 ![]() 粤公网安备44030502008569号
粤公网安备44030502008569号
腾讯云计算(北京)有限责任公司 京ICP证150476号 | 京ICP备11018762号