
Python图3变量数据在同一轴上?
Python图3变量数据在同一轴上?
提问于 2020-04-17 19:45:30
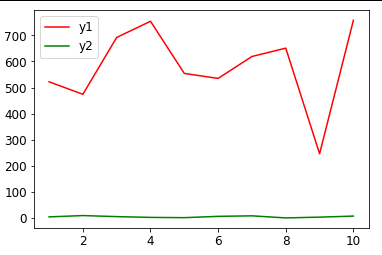
我们进行实验,我们的示波器给出所有的图在同一个屏幕上,虽然每个变量的大小不同。用实验数据在蟒蛇身上实现同样的目标是可能的吗?
我现在的代码和输出:
import random

x = [i for i in range(1,11,1)]
y1 = random.sample(range(100, 1000), 10)
y2 = random.sample(range(0, 10), 10)

plt.plot(x,y1,'-r')
plt.plot(x,y2,'-g')
plt.legend(['y1','y2'])
plt.show()
回答 1
Stack Overflow用户
回答已采纳
发布于 2020-04-17 20:00:10
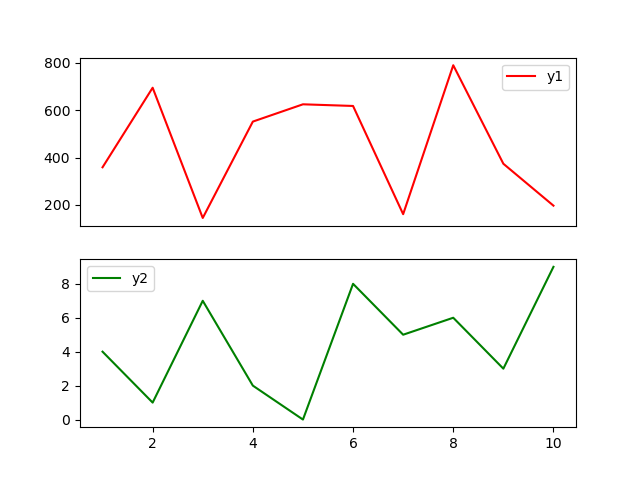
有一个非常简单的解决方案,只需使用子图。
import random
import matplotlib.pyplot as plt
x = [i for i in range(1,11,1)]
y1 = random.sample(range(100, 1000), 10)
y2 = random.sample(range(0, 10), 10)

ax1 = plt.subplot(211)
plt.plot(x,y1,'-r')
ax2 = plt.subplot(212,sharex=ax1)
plt.plot(x,y2,'-g')
ax1.get_shared_x_axes().join(ax1, ax2)
#make x axis on upper invisible
plt.setp(ax1.get_xaxis(), visible=False)

ax1.legend(['y1'])
ax2.legend(['y2'])
plt.show()
看上去像这样
您可以从上面的子图中移除底部的边框,从下子图中移除上边框,如下所示:
ax1.spines['bottom'].set_visible(False)
ax2.spines['top'].set_visible(False)
GridSpec可能会帮助您删除边距,但是我认为应该有一种更简单的方法来消除两个子图之间的距离。
页面原文内容由Stack Overflow提供。腾讯云小微IT领域专用引擎提供翻译支持
原文链接:
https://stackoverflow.com/questions/61279498
复制相关文章
相似问题
腾讯云开发者

Copyright © 2013 - 2026 Tencent Cloud. All Rights Reserved. 腾讯云 版权所有
深圳市腾讯计算机系统有限公司 ICP备案/许可证号:粤B2-20090059 ![]() 粤公网安备44030502008569号
粤公网安备44030502008569号
腾讯云计算(北京)有限责任公司 京ICP证150476号 | 京ICP备11018762号