
瀑布颜色和熊猫iloc格式
瀑布颜色和熊猫iloc格式
提问于 2020-04-22 08:52:58
我已经创建了一个瀑布使用Plotly通过创建两个数据文件从excel。我可以将数据的数字格式更改为3小数点,但当我使用iloc时则不能。有办法吗?
此外,我无法找到一个关于是否可以更改的答案:
bars
- background颜色的
- 个人颜色
- y轴标度和格式
我在下面添加了一个例子。
import plotly.express as px
import plotly.graph_objects as go

start = 0.143
ap = 0.02
impairments = 0.03
PVA = -0.02
other =0.04
rwa = 0.02
end = 0.146

fig = go.Figure(go.Waterfall(
name = "legend", orientation = "v",
measure = ["relative", "relative", "relative", "relative", "relative","relative","total"],
x = ["Start", "AP", "Impairments", "PVA", "Other", "RWA", "Final point"],
textposition = "outside",
text = [start*100, ap*100, impairments*100,PVA*100, other*100, rwa*100, end*100],
y = [start, ap, impairments, PVA, other, rwa, end],
connector = {"line":{"color":"rgb(63, 63, 63)"}}, ))
fig.update_layout(
title = "CET1 movements",
showlegend = False )
fig.show()
非常感谢
回答 1
Stack Overflow用户
发布于 2020-04-24 02:23:23
我想我找到了你要找的大部分东西。我评论了您要求的部分代码,并对您的代码进行了一些格式化。
import plotly.graph_objects as go
import pandas as pd
import numpy as np

x = ["Start", "AP", "Impairments", "PVA", "Other", "RWA", "Final point"]
y = [0.143, 0.02, 0.03,-0.02, 0.04, 0.02, 0.146]

df = pd.DataFrame({"x":x,
                   "y":y})

# here you better work with string
df["text"] = (df["y"]*100).apply(lambda x: '{:,.3f}'.format(x))

# to lazy to write all possible cases
df["measure"] = np.where(df["x"]=="Final point", "total", "relative")
# as alternative
# df["measure"] = ["relative"]*(len(df)-1) + ["total"]

fig = go.Figure()
fig.add_trace(
    go.Waterfall(x=df["x"],
                 y=df["y"],
                 text=df["text"],
                 measure=df["measure"],
                 textposition = "outside",
                 orientation = "v",
                 connector = {"line":{"color":"rgb(63, 63, 63)"}},
                 # set colors for different types of bars
                 # see https://plotly.com/python/waterfall-charts/#setting-marker-size-and-color
                 decreasing = {"marker":{"color":"Maroon",
                                         "line":{"color":"red",
                                                 "width":2}}},
                 increasing = {"marker":{"color":"Teal"}},
                 totals = {"marker":{"color":"orange",
                                     "line":{"color":'blue',
                                             "width":3}}}


                ))

# with this you can change the yaxes range
fig.update_yaxes(range=[0, 0.3])
fig.update_layout(title="CET1 movements",
                  title_x=0.5,
                  # background color
                  plot_bgcolor="lightgrey")
fig.show()
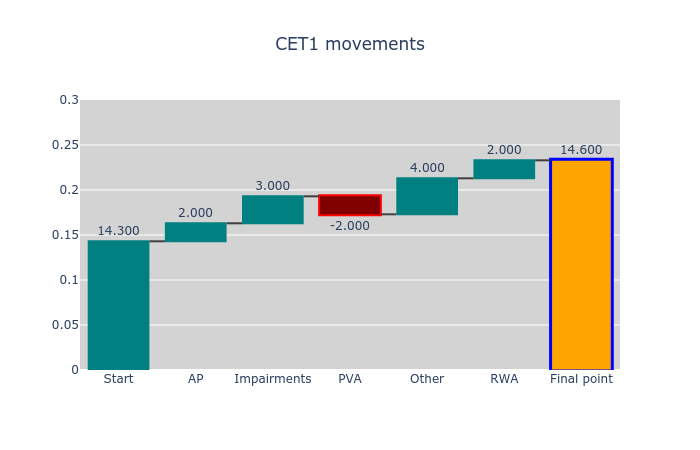
我认为我做的颜色选择是可怕的,但你可以做它。
页面原文内容由Stack Overflow提供。腾讯云小微IT领域专用引擎提供翻译支持
原文链接:
https://stackoverflow.com/questions/61361028
复制相关文章
相似问题
腾讯云开发者

Copyright © 2013 - 2026 Tencent Cloud. All Rights Reserved. 腾讯云 版权所有
深圳市腾讯计算机系统有限公司 ICP备案/许可证号:粤B2-20090059 ![]() 粤公网安备44030502008569号
粤公网安备44030502008569号
腾讯云计算(北京)有限责任公司 京ICP证150476号 | 京ICP备11018762号