
Gnuplot映射
Gnuplot映射
提问于 2020-05-12 09:35:30
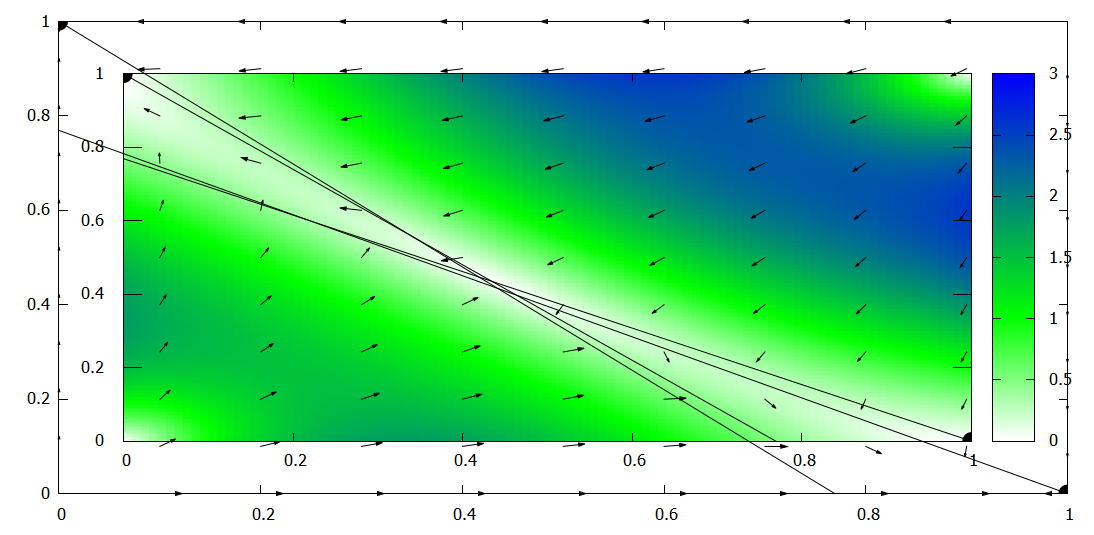
我遇到了一个问题,试图用一个向量场来绘制一些三维映射,问题是,我想要绘制梯度图,然后在地图上方绘制一个向量场。我有这样的代码:
####
reset
clear

set title '{/:Bold Retrato de fase b=1.120}' font ",18"
set xlabel "{/:Bold x1}"
show xlabel
set xrange[0:1]

set ylabel "{/:Bold x2}"
show ylabel
set yrange [0:1]
set multiplot
set multiplot layout 1,1
set origin 0,0

set palette defined ( 0 'white', 1 'green', 3 'blue' )
set pm3d map
set pm3d depthorder hidden3d

set key top left
set key Left
set samples 100,100
set style increment default
set style fill transparent

set arrow from 1,0 to 0,0.7692307692 nohead front
set arrow from 0,1 to 0.7692307692,0  nohead front

set object circle at graph 0,1 radius char 1 front \
    fillcolor rgb 'black' fillstyle solid noborder
set object circle at graph 1,0 radius char 1 front \
    fillcolor rgb 'black' fillstyle solid noborder

set pm3d
splot  "phase_portrait.txt" u 1:2:5 notitle  w pm3d
unset pm3d

plot "arrows.txt" u 1:2:3:4 w vectors filled head lc rgb 'black' notitle
####
以下是phase_portrait.txt归档的几行代码(每次x更改时,我都会在归档中放一个空行):
0.000000     0.000000    0.000000    0.000000    0.000000
0.000000     0.010000    0.000000    0.022222    0.117624
0.000000     0.020000    0.000000    0.022222    0.230543
0.000000     0.030000    0.000000    0.022222    0.338829
0.000000     0.040000    0.000000    0.022222    0.442552
0.000000     0.050000    0.000000    0.022222    0.541785
0.000000     0.060000    0.000000    0.022222    0.636598
0.000000     0.070000    0.000000    0.022222    0.727063
这些都来自arrows.txt:
0.000000     0.000000    0.000000    0.000000
0.000000     0.100000    0.000000    0.022222
0.000000     0.200000    0.000000    0.022222
0.000000     0.300000    0.000000    0.022222
0.000000     0.400000    0.000000    0.022222
0.000000     0.500000    0.000000    0.022222
0.000000     0.600000    0.000000    0.022222
0.000000     0.700000    0.000000    0.022222
无论我做什么,向量的输出都不匹配梯度图。我添加了输出的图像:
回答 1
Stack Overflow用户
回答已采纳
发布于 2020-05-12 16:07:35
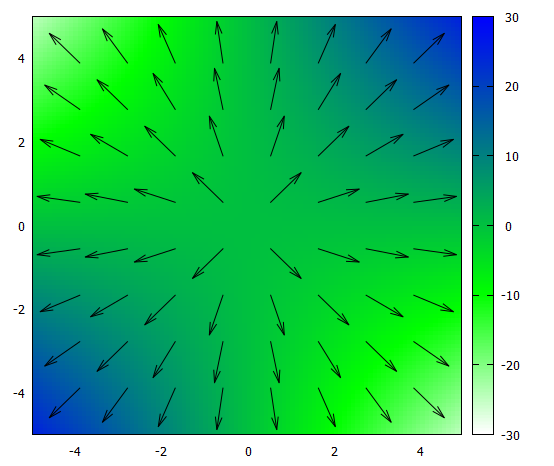
这里不需要使用multiplot,也不需要使用splot。下面的最小示例生成一些测试数据以进行说明。我希望你能根据你的需要修改代码。
代码:
### overlay of map and vectors
reset session

# create some test data for map
set samples 100
set isosamples 100
set table $Data
    plot '++' u 1:2:($1*$2) w table
unset table

# create some test data for vectors
set samples 10
set isosamples 10
set table $Vectors
    plot '++' u 1:2:($1/sqrt($1**2+$2**2)):($2/sqrt($1**2+$2**2)) w table
unset table

set xrange[-5:5]
set yrange[-5:5]
set palette defined ( 0 'white', 1 'green', 3 'blue' )

plot $Data u 1:2:($1*$2) w image, \
     $Vectors u 1:2:3:4 w vec lc rgb "black" notitle
### end of code
结果:
页面原文内容由Stack Overflow提供。腾讯云小微IT领域专用引擎提供翻译支持
原文链接:
https://stackoverflow.com/questions/61748368
复制相关文章
相似问题
腾讯云开发者

Copyright © 2013 - 2026 Tencent Cloud. All Rights Reserved. 腾讯云 版权所有
深圳市腾讯计算机系统有限公司 ICP备案/许可证号:粤B2-20090059 ![]() 粤公网安备44030502008569号
粤公网安备44030502008569号
腾讯云计算(北京)有限责任公司 京ICP证150476号 | 京ICP备11018762号