
我如何在阿托尼中动态地过滤矢量?
我如何在阿托尼中动态地过滤矢量?
提问于 2020-05-12 19:34:03
我正在尝试实现滚动窗口值在风险中的聚合,并想知道在Atoti中是否可行:我的主要问题是我不知道如何通过索引来过滤每个“观察窗口”的向量。
- 我的数据是10年的历史模拟PL
- 我想计算每个观察窗口的百分位数,每个观察是连续250个历史日。
在文档中,我发现了如何基于静态索引创建子向量,这里是:https://docs.atoti.io/0.3.1/tutorial/07-arrays.html#Sub-arrays -但是我需要根据我正在查看的“观察窗口”来更改索引。
我的输入数据如下所示,其中每个向量包含2500个值,我们需要计算具有250个连续值的重叠子向量的百分位数:
Book Vectors
A [877.30;137.33;-1406.62;-156.48;-915.56;1702.2...
B [2182.98;394.09;-845.23;-422.25;-2262.86;-2010...
C [9.94;972.31;1266.79;178.33;-102.00;508.13;-23...
我希望能够为每个观察窗口显示VaR,例如:
WindowIndex VaR
0   -98.8
1   -1000.9
2   -500.88
...     ...
2250    -088.7
或者,更好的:
WindowStartDate VaR
2011-05-17  -98.8
2011-05-18  -1000.9
2011-05-19  -500.88
...     ...
2019-12-31  -088.7
这段代码复制了用例-- "VaR向量“是我难以传递索引的地方:
# sample data
import pandas as pd
import random

history_size = 2500 # 10 years of data
var_window_length = 250

df =pd.DataFrame(data = {
    'Book': ['A', 'B', 'C'],
    'Vectors': [[';'.join(["{0:.2f}".format(random.gauss(0,1000)) for x in range(history_size)])] for y in range(3)]
})


# atoti part
import atoti as tt
session = tt.create_session()
store = session.read_pandas(
    df, keys=["Book"], store_name="Store With Arrays", array_sep=";"
)

cube = session.create_cube(store, "Cube")
lvl = cube.levels
m = cube.measures

# historical dates:
historical_dates = pd.bdate_range(periods = history_size - var_window_length + 1, end = pd.Timestamp('2019-12-31'), freq='B')
historical_dates

# This measure aggreates vectors across positions:
cube.query(m["Vectors.SUM"])

# This measure will display vectors for a given window - but how can I pass the right indexes for each observation window?
m["VaR Vector"] = m["Vectors.SUM"][???]

# This measure will compute VaR from each subvector:
m["95 percentile"] = tt.array.percentile(m["VaR Vector"], 0.05, "simple")回答 1
Stack Overflow用户
回答已采纳
发布于 2020-05-14 12:42:32
您可以使用参数层次结构创建带有索引的日期层次结构,然后在数组上使用此索引来接受大小为250的PNL子数组。
# Convert the date range to list
dates = list(historical_dates)
# Create the date hierarchy and an index measure
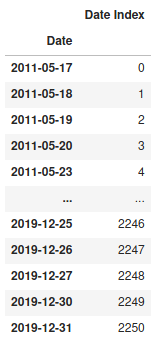
cube.create_parameter_hierarchy("Date", dates, index_measure="Date Index")
cube.query(m["Date Index"], levels=lvl["Date"])
# Take subarray using this index measure
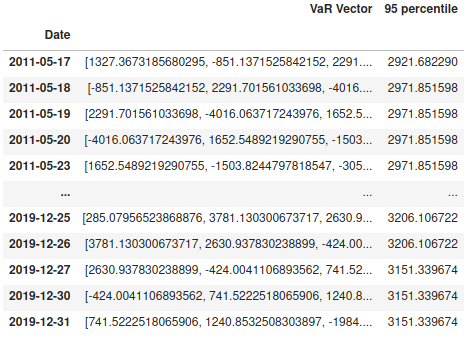
m["VaR Vector"] = m["Vectors.SUM"][m["Date Index"]:m["Date Index"]+250]
# take the 95 percentile of the subarray
m["95 percentile"] = tt.array.percentile(m["VaR Vector"], 0.95, mode="simple")
cube.query( m["VaR Vector"], m["95 percentile"], levels=lvl["Date"])
cube.visualize("percentile per date")
免责声明:我是atoti团队的开发人员。
页面原文内容由Stack Overflow提供。腾讯云小微IT领域专用引擎提供翻译支持
原文链接:
https://stackoverflow.com/questions/61760415
复制相关文章
相似问题
腾讯云开发者

Copyright © 2013 - 2026 Tencent Cloud. All Rights Reserved. 腾讯云 版权所有
深圳市腾讯计算机系统有限公司 ICP备案/许可证号:粤B2-20090059 ![]() 粤公网安备44030502008569号
粤公网安备44030502008569号
腾讯云计算(北京)有限责任公司 京ICP证150476号 | 京ICP备11018762号