
使用R: Error消息中的Dismo包中的randomPoints()函数生成psuedo缺位数据的物种分布模型
目标:
我的目标是使用randomPoints()函数在Dismo软件包中建立物种分布预测模型,其目的是生成伪缺失点并在地图上绘制它们。这些点将被转换成一个rastor文件,以便从MODIS文件中提取元数据(即海面盐度、叶绿素水平等),作为重要的生态预测指标,以确定它们如何影响蓝鲸的分布。
其思想是将包含相关元数据值的存在和伪缺位数据插入到通用线性混合(GLM),中,这将最终使我的模型更加平衡和准确。
问题概要:
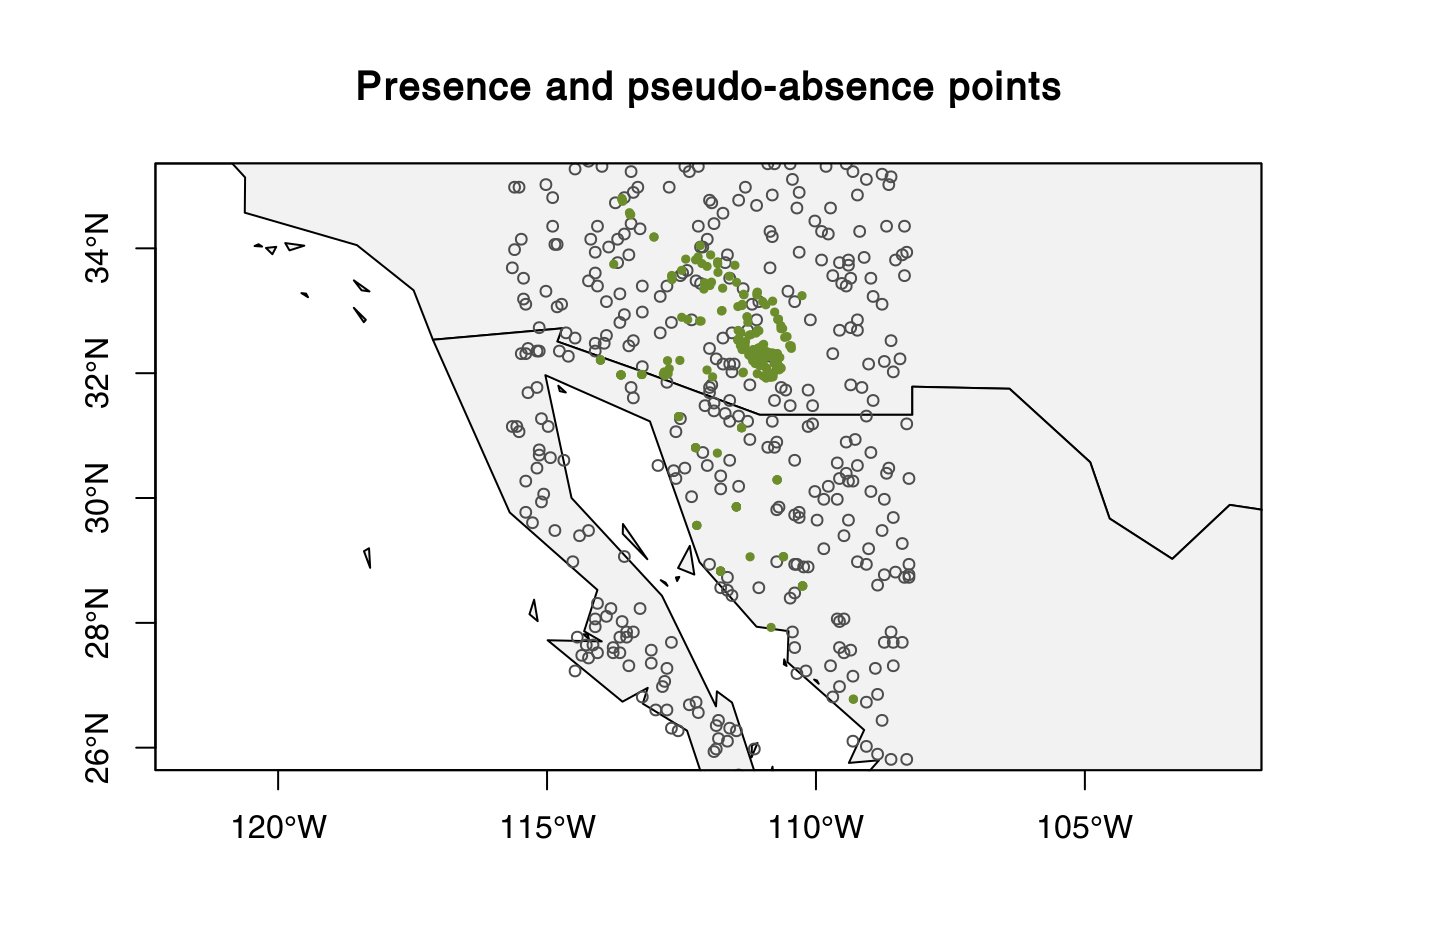
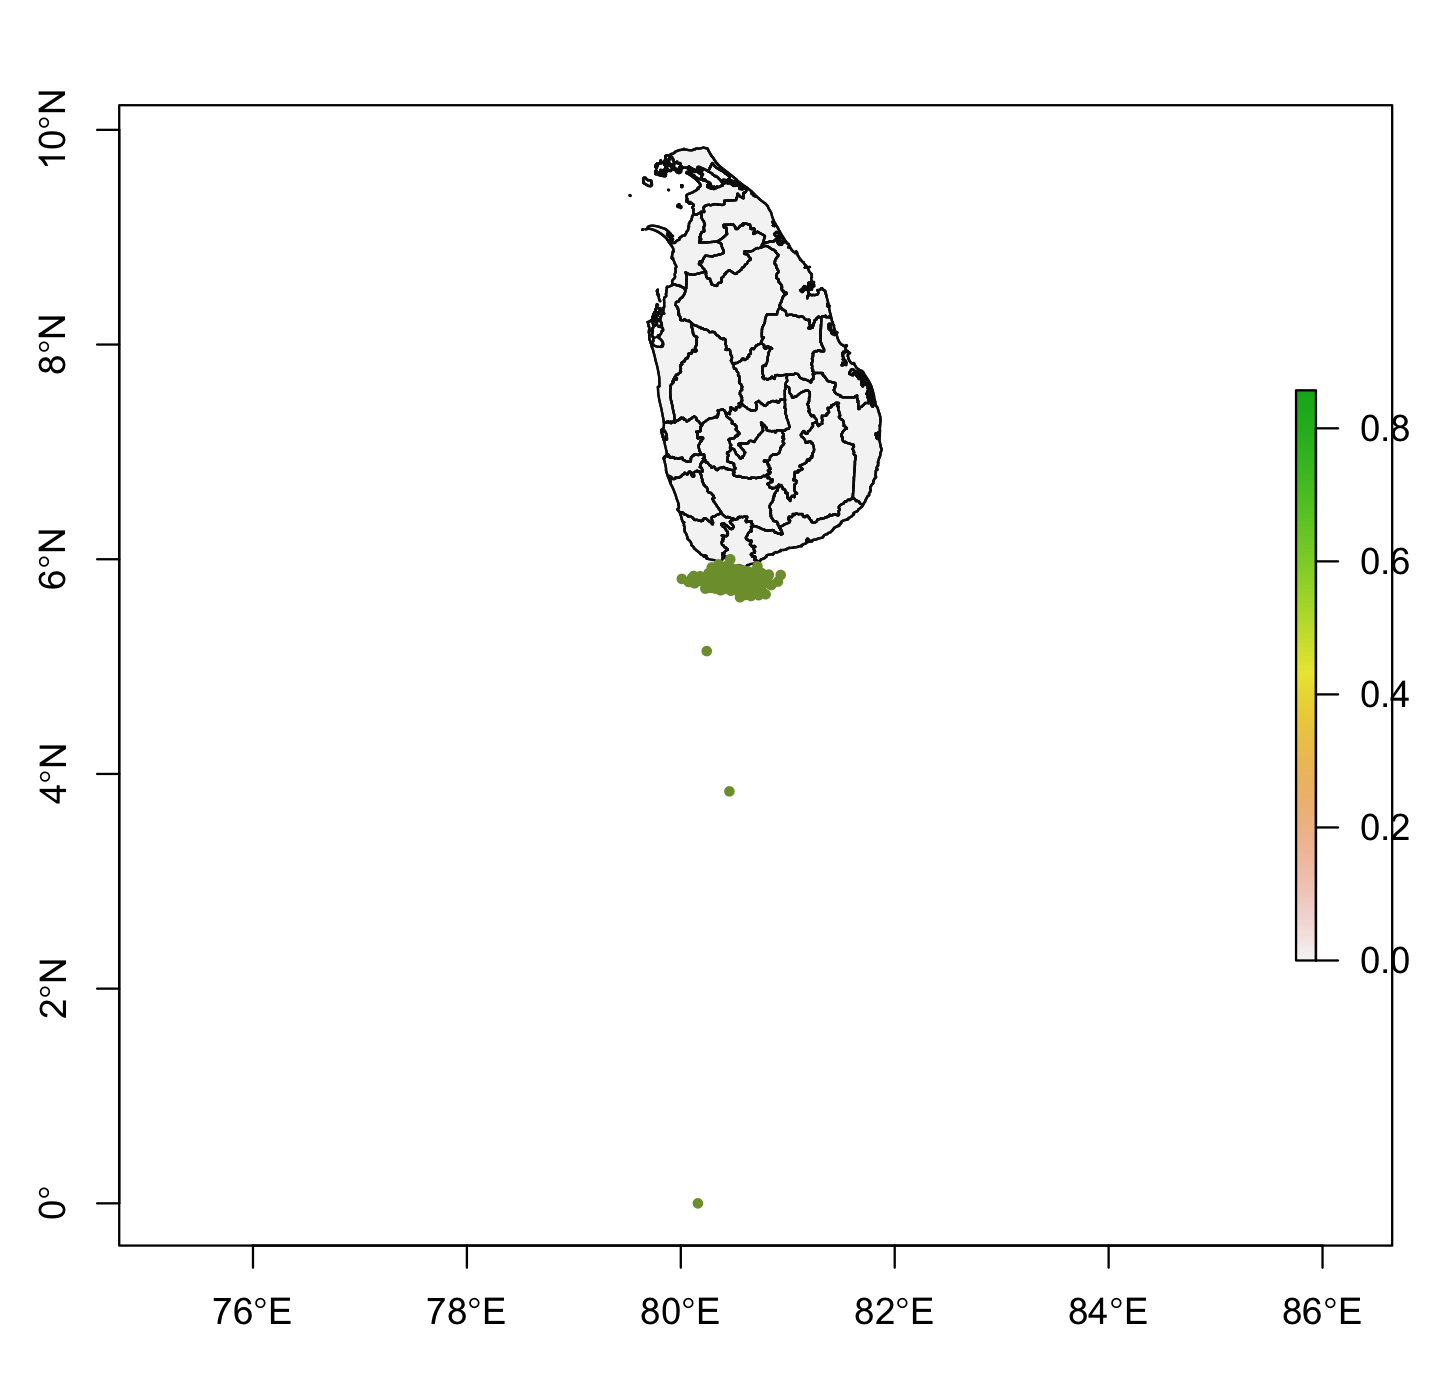
我试图跟随这个物种分布运动来使用randomPoints()函数生成伪缺位点(期望的输出:见图1)。然而,在运行我的R-代码(见下文)之后,我正在体验这个R错误消息(见下文)。我的r码还生成了一个地图与全球定位系统点绘制(图2).
错误消息:
(函数(类、fdef、mtable)中的错误:无法为函数‘nlayers’找到用于签名‘standardGeneric’的继承方法
我试图找到解决办法。然而,对于在R中使用地图,我相对来说还是比较新的,我对这里的问题感到很困惑!
我的数据框架包含918行,我希望生成与存在点相同的伪缺勤点数。不幸的是,我不能发布我的数据,但我提供了一个迷你数据框架作为一个例子。
如果有人能帮我,我会非常感激的!
事先非常感谢!
R-代码:
 ###Open Packages

    library("sp")
    library("rgdal")
    library("raster")
    library("maptools")
    library("rgdal")
    library("dismo")
    library("spatialEco")
    library("ggplot2")
    library("dplyr")
    library("maps")
    library("ggspatial")
    library("GADMTools")
    library("maps")

    ##Mini Dataframe
    Blue.whale_New <- data.frame(longitude = c(80.5, 80.5, 80.5, 80.5, 80.4, 80.4, 80.5, 80.5, 80.4),
                             latitude = c(5.84, 5.82, 5.85, 5.85, 5.89, 5.82, 5.82, 5.84, 5.83))


    ####World Bioclim Data + GADM Object

    ##Creating an array object with just longitude and latitude decimal coordinates
    ##Upload the maps
    ##Plotting the map of Sri Lanka
    ###GADM OBJECT

    dev.new()
    bioclim1.data <- getData('GADM', country='LKA', level=1)

    #####Worldclim raster layers

    bioclim.data <- getData(name = "worldclim",
                            var = "bio",
                            res = 2.5,
                            path = "./")

    ####Get bounding box of Sri Lanka shape file
    bb=bioclim1.data@bbox

    # Determine geographic extent of our data
    max.lat <- ceiling(max(Blue.whale$latitude))
    min.lat <- floor(min(Blue.whale$latitude))
    max.lon <- ceiling(max(Blue.whale$longitude))
    min.lon <- floor(min(Blue.whale$longitude))
    geographic.extent <- extent(x = c(min.lon, max.lon, min.lat, max.lat))

    #####Plot map
    dev.new()

    plot(bioclim1.data,
         xlim = c(min(c(min.lon,bb[1,1])), max(c(max.lon,bb[1,2]))),
         ylim = c(min(c(min.lat,bb[2,1])), max(c(max.lat,bb[2,2]))),
         axes = TRUE,
         col = "grey95")

    # Add the points for individual observation
    points(x = Blue.whale$longitude,
           y = Blue.whale$latitude,
           col = "olivedrab",
           pch = 15,
           cex = 0.50)

    ###Building a model and visualising results

    ##Crop bioclim data to geographic extent of blue whales GADM Map
    bioclim.data.blue.whale_1<-crop(x=bioclim1.data, y=geographic.extent)

    ##Crop bioclim data to geographic extent of blue whales World Clim
    bioclim.data.blue.whale_2<-crop(x = bioclim.data, y = geographic.extent)

    #Build distribution mode using the World Clim)

    bw.model <- bioclim(x = bioclim.data, p = Blue.whale_New)

    # Predict presence from model
    predict.presence <- dismo::predict(object = bw.model, x = bioclim.data, ext = geographic.extent)

    # Plot base map

    dev.new()

    plot(bioclim1.data,
         xlim = c(min(c(min.lon,bb[1,1])), max(c(max.lon,bb[1,2]))),
         ylim = c(min(c(min.lat,bb[2,1])), max(c(max.lat,bb[2,2]))),
         axes = TRUE,
         col = "grey95")

    # Add model probabilities
    plot(predict.presence, add = TRUE)

    # Redraw those country borders
    plot(bioclim1.data, add = TRUE, border = "grey5")

    # Add original observations
    points(Blue.whale_New$longitude,
           Blue.whale_New$latitude,
           col = "olivedrab", pch = 20, cex = 0.75)

    ##Psuedo Absence Points

    # Use the bioclim data files for sampling resolution
    bil.files <- list.files(path = "data/wc2-5",
                            pattern = "*.bil$",
                            full.names = TRUE)

    # Randomly sample points (same number as our observed points)

    ##Mask = provides resolution of sampling points
    ##n = number of random points
    ##ext = Spatially restricts sampling
    ##extf = expands sampling a little bit

    background <- randomPoints(mask = mask,
                               n = nrow(Blue.whale_New),
                               ext = geographic.extent,
                               extf = 1.25)

#Error in (function (classes, fdef, mtable)  :
  unable to find an inherited method for function ‘nlayers’ for signature ‘"standardGeneric"’
代码我计划在解决了问题后运行
Visualize the pseudo-absence points on a map:

# Plot the base map

dev.new()

plot(bioclim1.data,
     xlim = c(min(c(min.lon,bb[1,1])), max(c(max.lon,bb[1,2]))),
     ylim = c(min(c(min.lat,bb[2,1])), max(c(max.lat,bb[2,2]))),
     axes = TRUE,
     col = "grey95")

# Add the background points
points(background, col = "grey30", pch = 1, cex = 0.75)

# Add the observations
points(x = Blue.whale_New$longitude,
       y = Blue.whale_New$latitude,
       col = "olivedrab",
       pch = 20,
       cex = 0.75)

box()

# Arbitrarily assign group 1 as the testing data group
testing.group <- 1

# Create vector of group memberships
group.presence <- kfold(x = Blue.whale_New, k = 5) # kfold is in dismo package
图像1(期望输出)
图像2:
回答 1
Stack Overflow用户
发布于 2020-06-01 13:30:26
我认为您的问题是,您不是将适当的掩码(例如光栅层)传递给randomPoints函数,而是传递mask函数本身,这是一个standardGeneric,因此产生了错误消息。
可以从要使用的预测光栅生成掩码,然后将其传递给randomPoints函数。
mask_r <- bioclim1.data[[1]] #just one raterLayer
mask_r[!is.na(mask_r)] <- 1 #set all non-NA values to 1
background <- randomPoints(mask = mask_r, #note the proper mask layer
                           n = nrow(Blue.whale_New),
                           ext = geographic.extent,
                           extf = 1.25)
我还没查过,但这个解决方案应该有效。
最好的
埃米利奥
https://stackoverflow.com/questions/61833317
复制相似问题
腾讯云开发者

Copyright © 2013 - 2026 Tencent Cloud. All Rights Reserved. 腾讯云 版权所有
深圳市腾讯计算机系统有限公司 ICP备案/许可证号:粤B2-20090059 ![]() 粤公网安备44030502008569号
粤公网安备44030502008569号
腾讯云计算(北京)有限责任公司 京ICP证150476号 | 京ICP备11018762号