
绘制Catplot时的额外绘图
绘制Catplot时的额外绘图
提问于 2020-05-30 13:36:04
使用以下代码:
import pandas as pd
import matplotlib.pyplot as plt
import seaborn as sns
%matplotlib inline
df1 = pd.DataFrame( {'category': {0: 'Cat', 1: 'Cat', 2: 'Cat', 3: 'Cat', 4: 'Dog', 5: 'Dog', 6: 'Dog', 7: 'Dog', 8: 'Dog', 9: 'Dog', 10: 'Dog', 11: 'Dog', 12: 'Dog', 13: 'Dog', 14: 'Dog', 15: 'Dog', 16: 'Dog', 17: 'Dog', 18: 'Dog', 19: 'Dog'}, 'shape': {0: 'Small', 1: 'Small', 2: 'Small', 3: 'Small', 4: 'Small', 5: 'Small', 6: 'Small', 7: 'Medium', 8: 'Medium', 9: 'Large', 10: 'Small', 11: 'Small', 12: 'Small', 13: 'Small', 14: 'Small', 15: 'Small', 16: 'Small', 17: 'Small', 18: 'Small', 19: 'Small'}} )
plt.figure(figsize=(5,5),facecolor='#ffffff')
ax = plt.axes(facecolor='#ffffff')
plt.xticks(rotation=25)
sns.catplot(x='shape', hue='category', kind ='count', data = df1, height=5, aspect=1,ax=ax)
plt.xlabel('Diamond Shape')
plt.show()
我有下面的情节
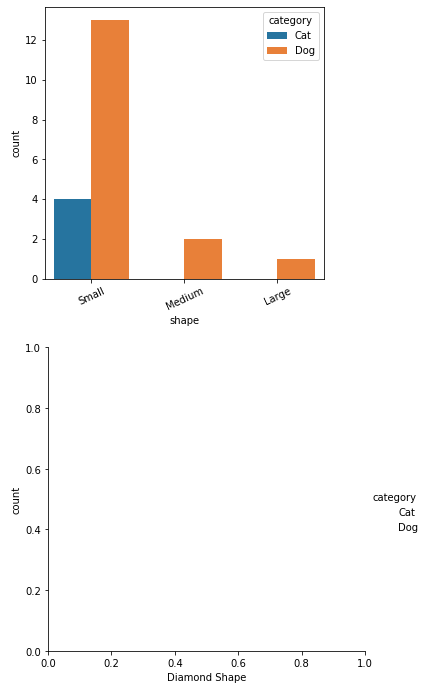
为什么下面有一个额外的空白地块?怎么才能不产生这种情况呢?(我需要ax为catplot提供额外的格式化)
回答 1
Stack Overflow用户
回答已采纳
发布于 2020-05-31 15:05:56
您可以使用以下技巧:在plt.show()之前关闭额外的数字
plt.close(2)
plt.show()页面原文内容由Stack Overflow提供。腾讯云小微IT领域专用引擎提供翻译支持
原文链接:
https://stackoverflow.com/questions/62103220
复制相关文章
相似问题
腾讯云开发者

Copyright © 2013 - 2026 Tencent Cloud. All Rights Reserved. 腾讯云 版权所有
深圳市腾讯计算机系统有限公司 ICP备案/许可证号:粤B2-20090059 ![]() 粤公网安备44030502008569号
粤公网安备44030502008569号
腾讯云计算(北京)有限责任公司 京ICP证150476号 | 京ICP备11018762号