
matplotlib -图3柱状图,在y轴上有百分比
matplotlib -图3柱状图,在y轴上有百分比
提问于 2020-06-01 15:30:31
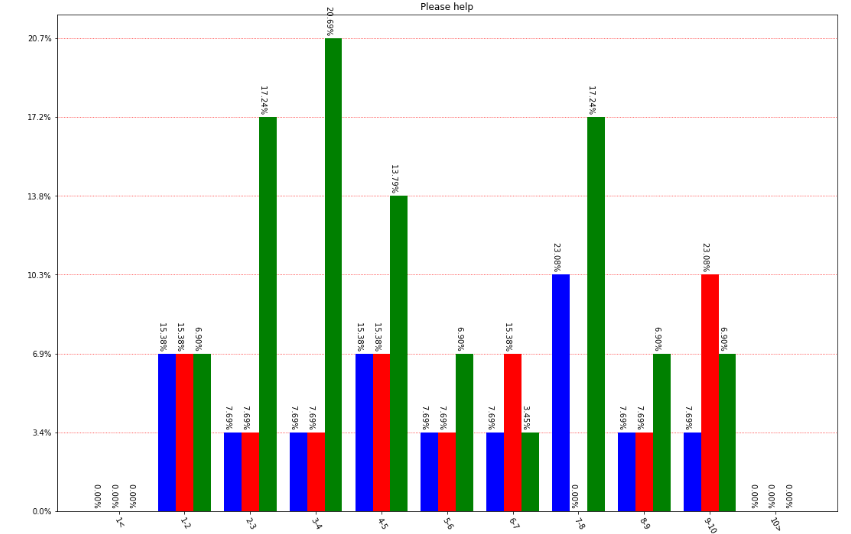
我试图在相同的图上有3个直方图,但对y轴上的百分比不确定。你可以看到我想做什么,但我到不了那里!条子不缩放属性,也不知道怎么做!请帮帮忙
data_1 = [1,1,2,3,4,4,5,6,7,7,7,8,9]
data_2 = [4,2,3,4,1,1,6,8,9,9,9,5,6]
data_3 = [1,2,3,4,5,6,7,8,9,9,4,3,7,1,2,3,2,5,7,3,4,7,3,8,2,3,4,7,2]

bin = [1,10,1]
bin[1] += bin[2]*2
bin[0] -= bin[2]
bins_list = np.arange(bin[0],bin[1],bin[2])
fig, ax = plt.subplots(figsize=(15, 10))

counts, bins, patches = plt.hist((np.clip(data_1 , bins_list[0], bins_list[-1]),np.clip(data_2, bins_list[0], bins_list[-1]),np.clip(data_3, bins_list[0], bins_list[-1])),
                        rwidth=0.8,
                        bins=bins_list, color=('blue', 'red', 'green'),
                        weights=None)

xlabels = bins[1:].astype(str)
xlabels[-1] = xlabels[-2] + '>'
xlabels[0] = xlabels[0] + '<'

for lb in range(1, len(xlabels)-1):
    xlabels[lb] = str(bins_list[lb])+'-'+xlabels[lb]

N_labels = len(xlabels)
plt.xticks(bin[2] * np.arange(N_labels)+bin[2]/2 + bin[0], rotation=300)
ax.set_xticklabels(xlabels)
total = 0

''' Add percentages and value for each bar '''
for c in range(len(patches)):
    for count, p in zip(counts[c], patches[c]):
        percentage = '%0.2f%%  ' % (100 * float(count) / counts[c].sum())
        total += 100 * float(count) / counts[c].sum()
        x1 = p.get_x()
        y1 = p.get_y() + p.get_height()
        ax.annotate(percentage, (x1, y1), rotation=270, fontsize = 10)

ax.yaxis.set_major_formatter(tkr.PercentFormatter(xmax=len(data_3)))


ax.grid(axis='y', color='r',  linestyle=':')
ax.set_title("Please help")

ax.set_axisbelow(True)
fig.tight_layout()
上述代码的绘图结果
回答 1
Stack Overflow用户
回答已采纳
发布于 2020-06-01 15:35:05
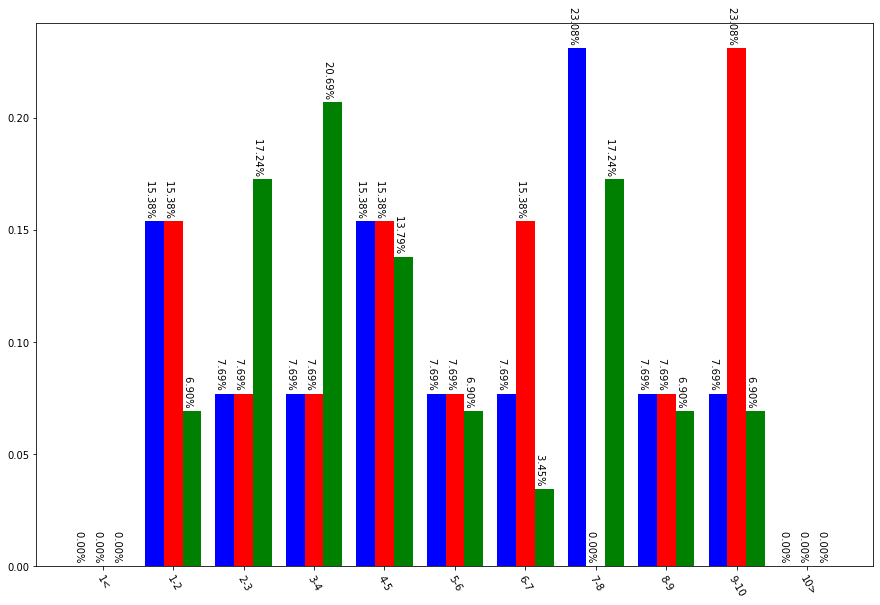
您可以在density=True上传递plt.hist
counts, bins, patches = plt.hist((np.clip(data_1 , bins_list[0], bins_list[-1]),
                                  np.clip(data_2, bins_list[0], bins_list[-1]),
                                  np.clip(data_3, bins_list[0], bins_list[-1])),
                        rwidth=0.8,
                        density=True,                                  # here
                        bins=bins_list, color=('blue', 'red', 'green'),
                        weights=None)
输出:
页面原文内容由Stack Overflow提供。腾讯云小微IT领域专用引擎提供翻译支持
原文链接:
https://stackoverflow.com/questions/62135574
复制相关文章
相似问题
腾讯云开发者

Copyright © 2013 - 2026 Tencent Cloud. All Rights Reserved. 腾讯云 版权所有
深圳市腾讯计算机系统有限公司 ICP备案/许可证号:粤B2-20090059 ![]() 粤公网安备44030502008569号
粤公网安备44030502008569号
腾讯云计算(北京)有限责任公司 京ICP证150476号 | 京ICP备11018762号