
如何自定义r中的颜色调色板?
如何自定义r中的颜色调色板?
提问于 2020-06-19 01:51:29
我用这个代码来绘制北美温度变化的地图:
ggplot(maps, aes(y=Latitude, x=Longitude, z=variable)) +
  ggtitle(title)+
  scale_fill_brewer(palette = "Spectral")+
  geom_contour_filled(breaks = c(-Inf,-2., -1.5, -1., -0.5, 0, 0.5, 1, 1.5, 2, 3, 4, 5, 7, 9, 11,Inf))+
  xlim(-146,-44)+
  ylim(35,90)+
theme(plot.title = element_text(hjust = 0.5))我想要改变调色板,以更好的可视化。目前,它编写scale_fill_brewer(palette = "Spectral"),我将将其转换为自定义调色板
colors <- c(rgb(10,40,100,max=255),rgb(51,102,217,max=255),rgb(105,138,236,max=255),rgb(151,180,250,max=255),rgb(204,217,255,max=255),rgb(255,245,204,max=255),rgb(255,224,153,max=255),rgb(255,203,102,max=255),rgb(255,180,51,max=255),rgb(255,140,51,max=255),rgb(255,85,0,max=255),rgb(230,40,30,max=255),rgb(191,0,0,max=255),rgb(140,0,0,max=255),rgb(108,0,0,max=255),rgb(110,0,70,max=255))使用scale_fill_brewer(palette = colors)将以错误结束,我也尝试了palette(colors),但它也不起作用。
如何自定义参数可以识别的调色板?
回答 1
Stack Overflow用户
回答已采纳
发布于 2020-06-19 11:17:37
如果我正确理解您的问题,您希望创建一个自定义scale_...函数。简而言之,这是对源代码的深入研究。
我将展示一种方法,它将简单地修改包RColorBrewer、scales、当然还有ggplot2中的现有函数。
- 核心是修改
RcolorBrewer::brewer.pal,我猜这基本上就是您想要的。看到代码,它会根据您的"n“从颜色列表中选择正确的颜色。这就是你需要手动创建的东西。我只是复制了调色板"YlOrBr“中的颜色。需要考虑的是:布鲁尔调色板不是随机的,它们已经被测试和创建,因为它们可以识别打印、复制和色盲,所以我不确定创建自己的调色板是否非常聪明。查看https://colorbrewer2.org/以找到合适的调色板。修改底层颜色选择器scales:::brewer_pal - modify
-
scale_fill/scale_colorfunction
我已经把函数简化到核心了,所以它们不会进行常规的检查,而且不那么灵活。您可以修改原始函数以获得此功能。
library(ggplot2)
mybrewerpal <- function(n, name) {# modified RcolorBrewer::brewer.pal
## the first call to switch would not be necessary in this example,
## but I leave it in order to make the underlying structure in brewer.pal clearer
switch(name, mypal = switch(n - 2, rgb(c(255, 254, 217), c(247, 196, 95), c(188, 79, 14), maxColorValue = 255),
rgb(c(255, 254, 254, 204), c(255, 217, 153, 76), c(212, 142, 41, 2), maxColorValue = 255),
rgb(c(255, 254, 254, 217, 153), c(255, 217, 153, 95, 52), c(212, 142, 41, 14, 4), maxColorValue = 255),
rgb(c(255, 254, 254, 254, 217, 153), c(255, 227, 196, 153, 95, 52), c(212, 145, 79, 41, 14, 4), maxColorValue = 255),
rgb(c(255, 254, 254, 254, 236, 204, 140), c(255, 227, 196, 153, 112, 76, 45), c(212, 145, 79, 41, 20, 2, 4), maxColorValue = 255),
rgb(c(255, 255, 254, 254, 254, 236, 204, 140), c(255, 247, 227, 196, 153, 112, 76, 45), c(229, 188, 145, 79, 41, 20, 2, 4), maxColorValue = 255),
rgb(c(255, 255, 254, 254, 254, 236, 204, 153, 102), c(255, 247, 227, 196, 153, 112, 76, 52, 37), c(229, 188, 145, 79, 41, 20, 2, 4, 6), maxColorValue = 255)
))
}
brewer_pal2 <- # modified from scales:::brewer_pal
function() { # stripped down all arguments, just to show the core
function(n) {
mybrewerpal(n, "mypal") ##modified, usually this is selected by a function
## with type and name as arguments, selecting a palette from a list called scales:::brewer
}
}
scale_fill_custom <- ### modified from scale_fill_brewer, removed some arguments
function (..., aesthetics = "fill") {
discrete_scale(aesthetics, "custom", brewer_pal2(), ...) ## give a new name to the
## scale, it will create a new Scale object.
}
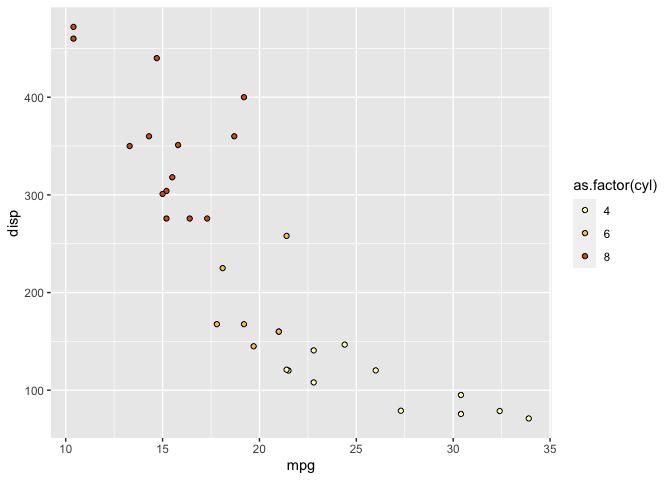
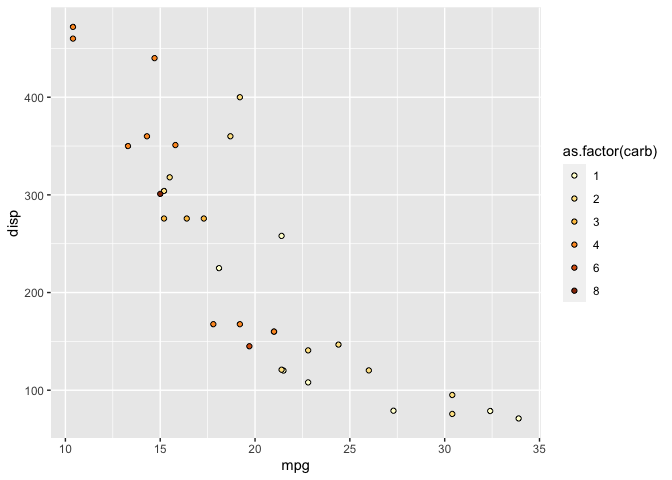
p <-
ggplot(mtcars, aes(x = mpg, y = disp)) +
scale_fill_custom()
p + geom_point(shape = 21, aes(fill = as.factor(cyl)))
p + geom_point(shape = 21, aes(fill = as.factor(carb)))
页面原文内容由Stack Overflow提供。腾讯云小微IT领域专用引擎提供翻译支持
原文链接:
https://stackoverflow.com/questions/62462030
复制相关文章
相似问题
腾讯云开发者

Copyright © 2013 - 2026 Tencent Cloud. All Rights Reserved. 腾讯云 版权所有
深圳市腾讯计算机系统有限公司 ICP备案/许可证号:粤B2-20090059 ![]() 粤公网安备44030502008569号
粤公网安备44030502008569号
腾讯云计算(北京)有限责任公司 京ICP证150476号 | 京ICP备11018762号